Time Zone: GMT +3
Time Frame: 4 Hours (H4)
Fundamental Analysis:
Today’s economic data releases from the Eurozone and the U.S. will likely influence the direction of the EUR/USD pair. For the Euro, German Industrial Production data reported a surprising increase of 0.8% after previously contracting by -2.4%, signaling a recovery in the manufacturing sector. This positive data, along with ECOFIN meetings and a speech by the German Bundesbank President, could boost sentiment toward the Euro.
From the U.S. side, the trade balance narrowed to -70.1B from -78.8B, reflecting improving economic conditions, which could support the U.S. Dollar. Additionally, FOMC members Kugler, Bostic, and Collins are scheduled to speak today, potentially providing insights into the Federal Reserve’s future monetary policy stance. Markets will also watch the NFIB Small Business Index, expected to rise to 92.0, which could further influence USD sentiment.
Price Action:
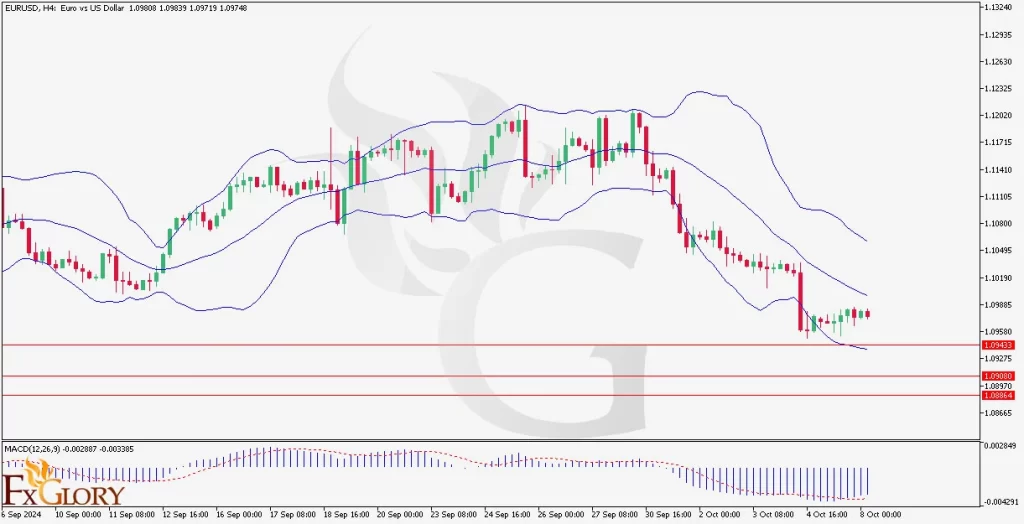
On the H4 chart, EUR/USD has been trading in a downtrend since mid-September, with the price currently hovering near the 1.0970 level. The Bollinger Bands indicate that the pair is oversold as the price touched the lower band, suggesting that a possible rebound could be on the horizon. Despite the recent bounce, the pair remains below key moving averages, reflecting overall bearish momentum.
The MACD shows continued bearishness, with the histogram below zero and declining. However, as the pair approaches key support levels, there could be a corrective movement if buyers manage to defend these levels.
Key Technical Indicators:
Bollinger Bands: The price has touched the lower band, indicating potential oversold conditions and a possible corrective bounce.
MACD: The indicator remains bearish, with the histogram and MACD line below the signal line, confirming ongoing selling pressure.
Support and Resistance:
Support Levels: Key support is located at 1.0945, with further support around 1.0890. A break below these levels could open the door for further declines toward 1.0865.
Resistance Levels: Immediate resistance is seen at 1.1020, which coincides with the middle Bollinger Band. A breakout above this level could push the pair toward the next resistance at 1.1080.
Conclusion and Consideration:
The EUR/USD H4 chart suggests a continuation of the bearish trend unless the pair manages to break above the immediate resistance levels. A bounce from the 1.0945 support could signal a potential correction, but the broader trend remains bearish. Traders should closely monitor today’s speeches from FOMC members and U.S. trade balance data, as these could provide further direction to the pair.
Disclaimer: The provided analysis is for informational purposes only and does not constitute investment advice. Traders should conduct their own research and analysis before making any trading decisions.