Time Zone: GMT +3
Time Frame: 4 Hours (H4)
Fundamental Analysis:
The BTCUSD forex pair reflects the exchange rate between Bitcoin (BTC) and the US Dollar (USD), a crucial instrument for cryptocurrency traders. Today’s market is poised for volatility due to significant economic releases in the US, including Non-Farm Payrolls (NFP) and the Unemployment Rate. These reports are essential indicators of economic strength, and a higher-than-expected NFP figure or lower unemployment rate may support the USD, leading to downward pressure on BTC/USD. Additionally, remarks from Federal Reserve Bank of New York President John Williams are anticipated, with any hawkish tone likely strengthening the USD. As labor inflation data is released, it could also contribute to volatility in the cryptocurrency market, as USD strength generally puts downward pressure on Bitcoin prices.
Price Action:
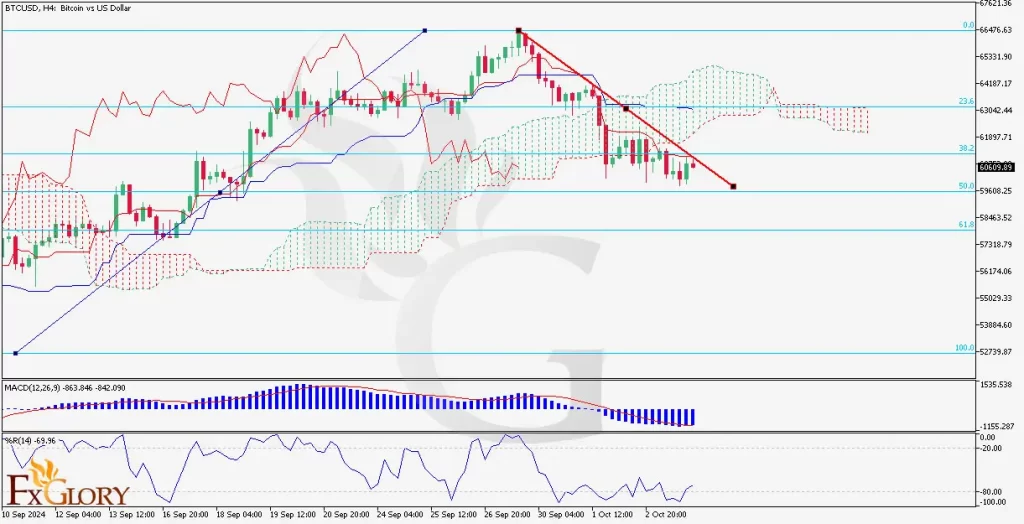
Looking at the BTC USD H4 chart, the price has been in a consistent downtrend after failing to maintain its bullish momentum from earlier weeks. The pair is currently trading below the Ichimoku cloud, a clear indication of bearish dominance. A descending trendline is capping any attempts for recovery, further confirming the bearish outlook. Price has been consolidating just above the 50% Fibonacci retracement level at $60,050, indicating a potential battle between buyers and sellers. If the price remains below this key support, the bears may push it lower, toward the 61.8% Fibonacci level at $58,483.
Key Technical Indicators:
Ichimoku Cloud: The price is currently below the Ichimoku cloud, which indicates bearish market conditions. The cloud itself is red and growing, suggesting that bearish momentum is likely to continue in the short term. The lagging span and future cloud are both below price action, adding to the negative outlook.
MACD (Moving Average Convergence Divergence): The MACD indicator shows bearish momentum, with the MACD line well below the signal line. The histogram is negative, and while it is contracting slightly, there’s no indication of a bullish crossover soon. This reinforces the bearish trend and suggests continued downward pressure.
%R Indicator (Williams %R): The %R is currently around the -70 mark, indicating that the market is in bearish territory but not yet oversold. This suggests that there is still room for the price to decline further before a potential reversal or consolidation.
Support and Resistance:
Support Levels: Immediate support is located at the 50% Fibonacci retracement level at $60,050. If this level breaks, the next significant support lies at the 61.8% Fibonacci level at $58,483. A failure to hold this could see the pair dropping towards $56,000.
Resistance Levels: On the upside, resistance is found at the descending trendline around $61,800. Above this, the next major resistance is at the 38.2% Fibonacci retracement level at $61,897, coinciding with the lower boundary of the Ichimoku cloud.
Conclusion and Consideration:
he BTC/USD H4 chart indicates a bearish bias in the market, with price trading below key technical levels, including the Ichimoku cloud and major Fibonacci retracement points. Bearish momentum appears strong, as confirmed by the MACD and %R indicators. However, any upside surprise in today’s US economic releases, particularly the NFP or unemployment figures, could add further downside pressure on Bitcoin. Traders should remain cautious as the market could see heightened volatility due to these upcoming fundamental drivers. The key support at $60,050 will be critical to watch, as a break below could signal deeper corrections toward $58,483.
Disclaimer: The provided analysis is for informational purposes only and does not constitute investment advice. Traders should conduct their own research and analysis before making any trading decisions.