Time Zone: GMT +3
Time Frame: 4 Hours (H4)
Fundamental Analysis:
The AUD/USD pair is currently influenced by critical economic events. Earlier today, the Reserve Bank of Australia (RBA) maintained its cash rate at 4.35%, which was anticipated by the market, accompanied by the RBA Rate Statement and subsequent Press Conference. These factors are crucial in shaping the Australian dollar’s direction against United States’ Dollar. The RBA’s stance was seen as relatively neutral, keeping future rate hikes uncertain. Meanwhile, on the USD side, significant events like the upcoming FOMC member Bowman’s speech and data releases, such as the S&P/CS Composite-20 HPI y/y (5.9%, below the expected 6.5%) and the CB Consumer Confidence report, are likely to weigh on the US dollar’s performance. With the U.S. data releases showing mixed results, traders are closely monitoring the market for any clues on future Fed policy moves.
Price Action:
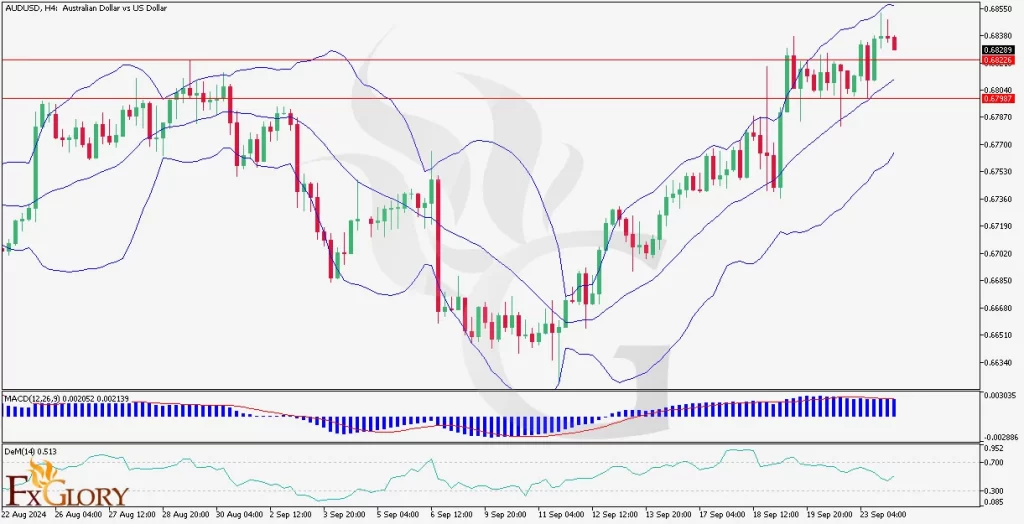
The AUD/USD H4 chart today shows a correction following a bullish rally. The price has now moved lower, testing a key support zone, indicating a consolidation phase. The Bollinger Bands show a sharp decline in volatility, with the price touching the lower band, suggesting the potential for a short-term bounce. However, the pair remains under pressure as both fundamental and technical factors point to a cautious sentiment. If AUD/USD breaks below current support, further downside may be expected, while holding above could see the pair attempt a recovery.
Key Technical Indicators:
Bollinger Bands: The price is currently hugging the lower Bollinger Band, indicating a possible oversold condition in the short term. A contraction in the bands suggests lower volatility, signaling that a breakout might be imminent.
MACD (Moving Average Convergence Divergence): The MACD is in bearish territory, with the MACD line below the signal line. The histogram is also below zero, supporting the bearish outlook. This indicates a potential for further downside if momentum doesn’t shift soon.
DeM (DeMarker Indicator): The DeMarker indicator is currently reading at 0.334, signaling that the pair may be in an oversold condition, which could indicate a short-term bullish reversal if buyers step in at current levels.
Support and Resistance:
Support Levels: The immediate support is at 1.35000, aligning with a key psychological level. A stronger support level is noted at 1.34610, which coincides with a previous low from earlier sessions.
Resistance Levels: The nearest resistance is at 1.35700, which aligns with the middle of the Bollinger Bands and prior consolidation. The next significant resistance is around 1.36050, which marks the upper boundary of the recent price action.
Conclusion and Consideration:
The AUD/USD technical analysis suggests a cautious outlook as the pair consolidates within the lower Bollinger Band range, signaling potential short-term downside pressure. However, oversold conditions on both the DeM and Bollinger Bands suggest a possible rebound if key support holds. Traders should monitor the MACD for confirmation of continued bearish momentum or potential reversal on AUDUSD price chart. Additionally, economic events like the RBA Press Conference and upcoming U.S. data releases could add volatility to the pair. In this uncertain market environment, prudent risk management is advised, with close attention paid to the 1.35000 support and 1.35700 resistance levels for any breakout signals.
Disclaimer: The provided analysis is for informational purposes only and does not constitute investment advice. Traders should conduct their own research and analysis before making any trading decisions.