Time Zone: GMT +3
Time Frame: 4 Hours (H4)
Fundamental Analysis:
The USD/CAD forex pair is influenced today by key fundamental events from both the U.S. and Canada. In the U.S., the market anticipates remarks from Federal Reserve Bank of Philadelphia President Patrick Harker at Tulane University. Traders will be watching for any hawkish signals regarding future monetary policy, which could strengthen the USD. On the Canadian side, Bank of Canada Governor Tiff Macklem is scheduled to speak at the National Bureau of Economic Research conference in Toronto. His commentary could provide insights into future interest rate policies, impacting the CAD. Additionally, the release of retail sales data and industrial product prices from Canada could drive market volatility depending on how the actual figures align with market forecasts.
Price Action:
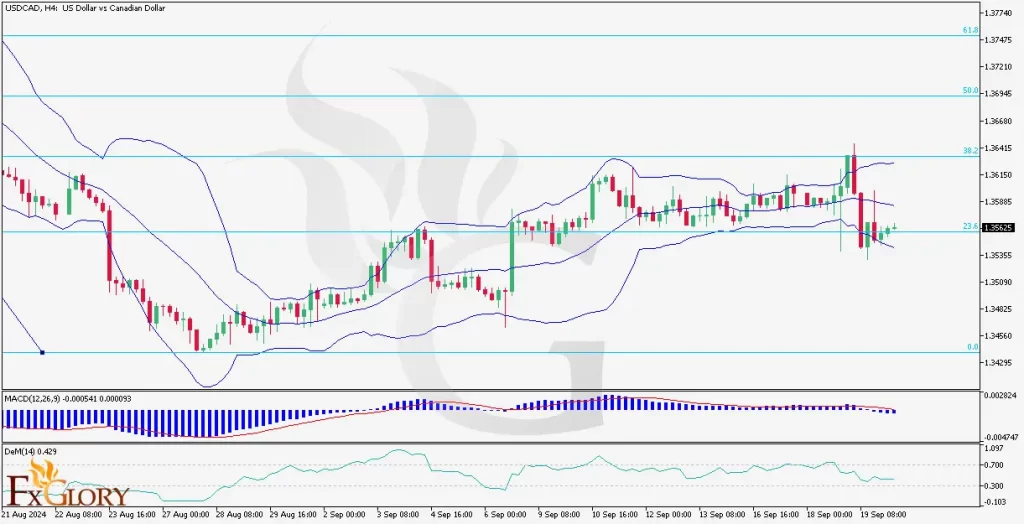
In the H4 timeframe, USDCAD has been trading in a range between 1.3500 and 1.3650 over the past few sessions, indicating consolidation after a bullish recovery. The price attempted to break out above 1.3650 but failed, pulling back toward the 23.6% Fibonacci retracement level. The recent candles suggest indecision as the price hovers near the 1.3565 level. This area has acted as a key pivot zone over the past few sessions, reflecting the current battle between bulls and bears.
Key Technical Indicators:
Bollinger Bands: The Bollinger Bands on the USD/CAD H4 chart have widened, signaling increased volatility. The price has moved toward the lower band after touching the upper band near 1.3650, indicating a potential downward pressure. However, the price remains within the bands, suggesting the market is not yet oversold. Traders should watch for a breakout of the bands to signal the next directional move.
MACD (Moving Average Convergence Divergence): The MACD indicator shows a weakening bullish momentum, with the MACD line crossing below the signal line and the histogram in negative territory. This bearish crossover signals a possible continuation of the downside momentum unless the MACD can reverse and move back above the signal line. However, the low distance between the lines suggests the trend could reverse if fundamentals support USD strength.
DeMarker (DeM 14): The DeMarker (DeM) indicator sits at 0.429, indicating potential oversold conditions. This suggests that there might be some buying interest soon if the indicator starts to rise. However, for now, the DeM signals that the downside pressure could continue in the near term unless a reversal occurs.
Support and Resistance:
Support: Immediate support for USDCAD is at 1.3565, aligned with the 23.6% Fibonacci retracement level and the recent price pivot. If the pair breaks below this, the next key support is at 1.3500, a psychological level that has historically acted as a strong barrier.
Resistance: Immediate resistance is found at 1.3640, which coincides with the 38.2% Fibonacci retracement level and marks the upper boundary of recent price action. A breakout above this level could push the pair toward 1.3695, the 50% retracement level, where further resistance may be encountered.
Conclusion and Consideration:
The USD-CAD pair is currently in a consolidation phase after failing to break above the 1.3640 resistance level. With technical indicators pointing toward slight bearish momentum and upcoming key fundamental events, the pair could face heightened volatility. Traders should closely monitor the speeches from the Federal Reserve and Bank of Canada governors, as these could provide clues on future interest rate decisions and drive price action. A break above 1.3640 would confirm a bullish breakout, while a move below 1.3560 could see the pair targeting 1.3500.
Disclaimer: The USD CAD analysis provided is for informational purposes only and does not constitute investment advice. Trading in the foreign exchange market involves significant risk, and it is essential for traders to conduct their research and stay updated with market conditions before making any trading decisions.