Time Zone: GMT +3
Time Frame: 4 Hours (H4)
Fundamental Analysis:
The GBPAUD pair represents the British Pound (GBP) against the Australian Dollar (AUD), both of which are influenced by central bank policies and global economic conditions. Today, the GBP faces significant news with the release of the Bank of England’s Monetary Policy Summary and voting breakdown, which could provide insight into the central bank’s stance on interest rates. Hawkish sentiments from the Bank of England could strengthen the GBP, leading to potential bullish momentum. On the AUD side, employment data and the unemployment rate are key market-moving events for today. Better-than-expected Australian employment figures could bolster the AUD, adding downward pressure on the pair. Both currencies are subject to central bank guidance and economic data, making today critical for GBP AUD price movements.
Price Action:
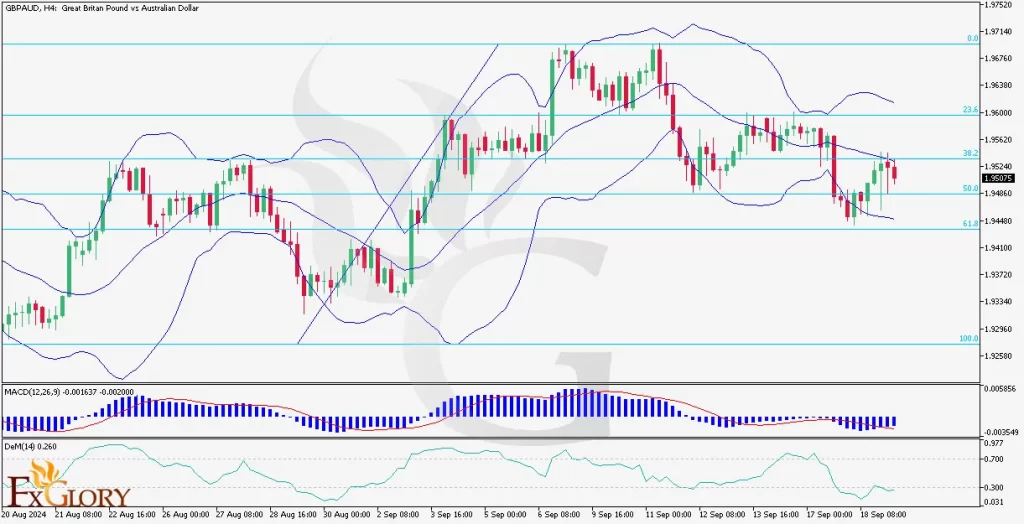
On the H4 timeframe, the GBP/AUD pair is currently showing bearish tendencies, as seen from the last two candles that have declined. The price is trading between the 38.2% and 50.0% Fibonacci retracement levels, indicating potential support near the 50.0% level. The GBPAUD Price action shows movement toward the lower half of the Bollinger Bands after briefly touching the middle band. This suggests a potential downward continuation. If the price breaks below the 50.0% Fibonacci level, we could see further bearish momentum.
Key Technical Indicators:
Bollinger Bands: The price has been moving from the lower band toward the middle band but is currently heading back toward the lower band. This indicates a bearish move, with volatility expected to increase as the price approaches the lower Bollinger Band. If the price remains in the lower half of the bands, it may continue on a downward path.
MACD (Moving Average Convergence Divergence): The MACD histogram is showing decreasing momentum, with the MACD line slightly below the signal line. This suggests bearish momentum is building, and traders should watch for a potential continuation of the downward trend if the MACD crosses further below the signal line.
DeMarker (DeM) (14): The DeMarker indicator currently sits at 0.260, which is below the neutral zone, indicating that the pair is nearing oversold conditions. While this suggests that the selling pressure could slow down, it also signals that there may be room for further bearish movement before a possible reversal.
Support and Resistance Levels:
Support: Immediate support is found at the 50.0% Fibonacci retracement level at approximately 1.9502. Further support can be seen near the 61.8% Fibonacci level at 1.9440.
Resistance: Immediate resistance is near the 38.2% Fibonacci level at 1.9562. Stronger resistance lies at 1.9600, aligning with the upper Bollinger Band.
Conclusion and Consideration:
In conclusion, the GBP AUD pair on the H4 chart shows signs of bearish momentum with the price moving toward the lower half of the Bollinger Bands and declining MACD momentum. The DeM indicator nearing oversold territory signals potential for a short-term reversal, but the overall bearish outlook remains dominant. Traders should watch key support and resistance levels, particularly around the 50.0% and 38.2% Fibonacci levels, for signs of a breakout or reversal. With important economic data releases from both the UK and Australia, heightened volatility is expected, making it crucial for traders to monitor these indicators closely.
Disclaimer: The GBPAUD H4 provided analysis is for informational purposes only and does not constitute financial advice. Traders should perform their own analysis and consider market conditions before making any trading decisions. Markets can change rapidly, and staying updated with the latest news is essential for successful trading.


