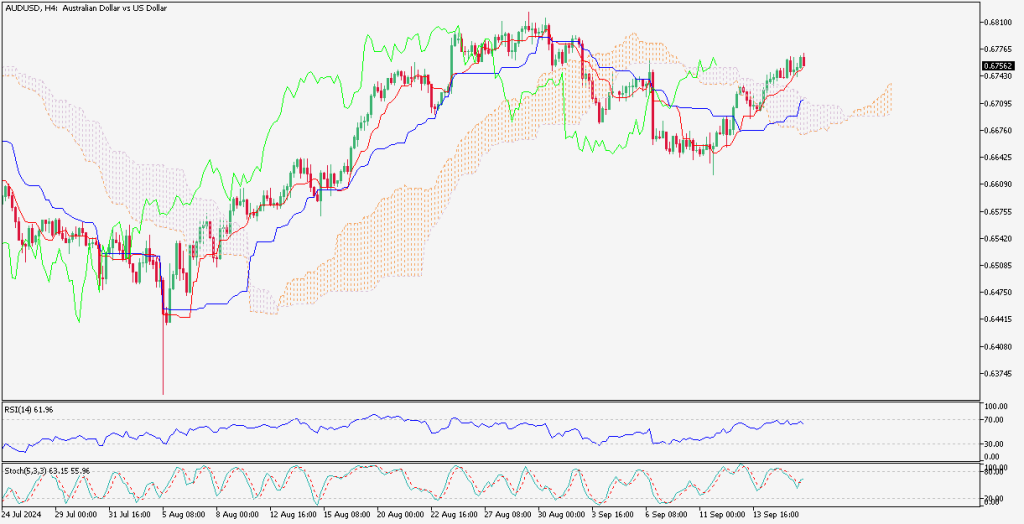
Time Zone: GMT +3
Time Frame: 4 Hours (H4)
Fundamental Analysis:
Upcoming economic data releases from the US and Australia are significant for understanding potential movements in the AUD/USD pair. From the US, the focus is on the Federal Funds Rate, which is expected to increase from 5.25% to 5.50%. Such a hike could strengthen the USD as higher interest rates usually attract foreign capital. Additionally, the FOMC Economic Projections and Statement will provide deeper insights into future monetary policy, which could sway market sentiment significantly. The TIC Long-Term Purchases, indicating foreign investments, jumped from 54.9B to an expected 96.1B, reflecting a robust interest in US financial assets.
From Australia, the Employment Change is set to show a sharp rise from 26.4K to 58.2K, suggesting strong job market conditions, which could bolster the AUD. The Unemployment Rate is projected to hold steady at 4.2%, supporting a stable economic outlook in Australia.
Price Action:
The AUD/USD price shows a consolidation above the Ichimoku cloud on the H4 chart, indicating a bullish sentiment in the near term. The RSI is above 50 but not yet in the overbought territory, suggesting there is room for upward movement without immediate reversal risks. The Stochastic indicator hints at the end of a bearish phase, potentially signaling an upcoming bullish crossover.
Key Technical Indicators:
RSI: hovering above 50,ing towards potential upward movements.
Stochastic: Indicating the exhaustion of bearish momentum with a possible bullish turn ahead.
Ichimoku Cloud: The price residing above the cloud supports bullish dominance, suggesting potential further upsides.
Support and Resistance:
Support Levels: The nearest support level is found just above the lower boundary of the Ichimoku cloud at 0.6600. A drop below this level could lead to further bearish corrections towards 0.6550.
Resistance Levels: Immediate resistance is observed at the downward trend line from the recent correction phase. A decisive breakout above 0.6750 could reaffirm the bullish trend, aiming for the next resistance at 0.6800.
Conclusion and Consideration:
The AUD/USD H4 chart points to a bullish continuation as long as the price remains above the Ichimoku cloud. The anticipated breakout above the current descending trend line could usher in renewed bullish momentum. Traders should closely monitor the forthcoming economic data from both the US and Australia, as these will likely drive short-term price action and confirm or adjust the current bullish outlook.
Disclaimer: The provided analysis is for informational purposes only and does not constitute investment advice. Traders should conduct their own research and analysis before making any trading decisions.
FXGlory
09.18.2024


