Time Zone: GMT +3
Time Frame: 4 Hours (H4)
Fundamental Analysis:
The CAD/JPY fundamental analysis today is influenced by various macroeconomic factors and market sentiment. The Canadian Dollar is often correlated with oil prices, as Canada is a major oil exporter. Rising oil prices typically strengthen the CAD. Meanwhile, the Japanese Yen, often seen as a safe-haven currency, is influenced by global risk sentiment and Japan’s economic indicators, such as machine orders and monetary policy. The upcoming release of Japan’s machine orders data is crucial as it may affect the JPY by indicating the health of Japan’s manufacturing sector. A stronger-than-expected release could lead to a stronger Yen, putting pressure on the CAD/JPY forecast.
Price Action:
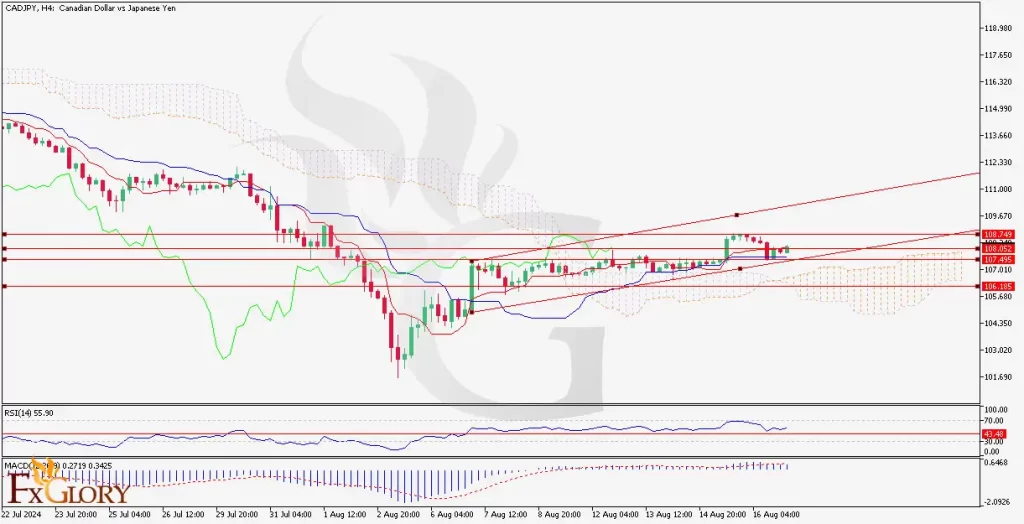
The CAD/JPY H4 chart shows that the pair has been in a consolidation phase after a previous downtrend. The price is currently moving within a channel, bounded by rising trendlines, suggesting a gradual upward movement. However, recent candles indicate a struggle to break above the immediate resistance, highlighting potential indecision in the market. The pair’s price action shows it has recently tested and held above a key support level, which could suggest a buildup for another upward push if it holds.
Key Technical Indicators:
Ichimoku Cloud: The price is trading near the upper boundary of the Ichimoku Cloud, which acts as resistance. A break above this level could signal a potential bullish breakout, while failure to do so might lead to a retracement.
RSI (Relative Strength Index): The RSI is currently at 55.90, indicating that the pair is in neutral to slightly bullish territory. There’s still room for upward movement before the market reaches overbought conditions.
MACD (Moving Average Convergence Divergence): The MACD line is slightly above the signal line, and the histogram is in positive territory, suggesting that the bullish momentum is still intact but not overwhelmingly strong.
Support and Resistance:
Support Levels: The key support levels are at 107.495 and 107.010, with the latter being crucial as it aligns with the lower trendline of the channel.
Resistance Levels: Immediate resistance is found at 108.052, followed by a stronger resistance at 108.749. A break above these levels could lead to further gains toward 109.500.
Conclusion and Consideration:
The CAD/JPY technical analysis today on the pair’s H4 chart depicts a consolidation phase with the potential for an upward breakout if it can sustain above the current resistance levels. Traders should monitor the RSI for signs of overbought conditions and the MACD for any changes in momentum. Given the upcoming machine orders data from Japan, there may be increased volatility in the pair. Conservative traders might wait for a clear breakout from the current range before entering new positions. It’s also advisable to implement risk management strategies, such as stop-loss orders, especially given the pair’s proximity to key resistance levels.
Disclaimer: The provided analysis is for informational purposes only and does not constitute investment advice. Traders should conduct their own research and analysis before making any trading decisions.


