Time Zone: GMT +3
Time Frame: 4 Hours (H4)
Fundamental Analysis:
The USD/JPY news analysis today is influenced by several fundamental factors, including economic indicators from the United States and Japan. For the USD, upcoming data from the National Association of Realtors and the Federal Reserve Bank of Richmond are crucial. Home resales, which reflect consumer confidence and economic health, can significantly impact the USD. Similarly, the Richmond Fed Index provides insights into manufacturing activity, which is vital for economic growth. For the JPY, the S&P Global Manufacturing PMI is a key indicator. This index reflects the health of the manufacturing sector and overall economic conditions in Japan.
Price Action:
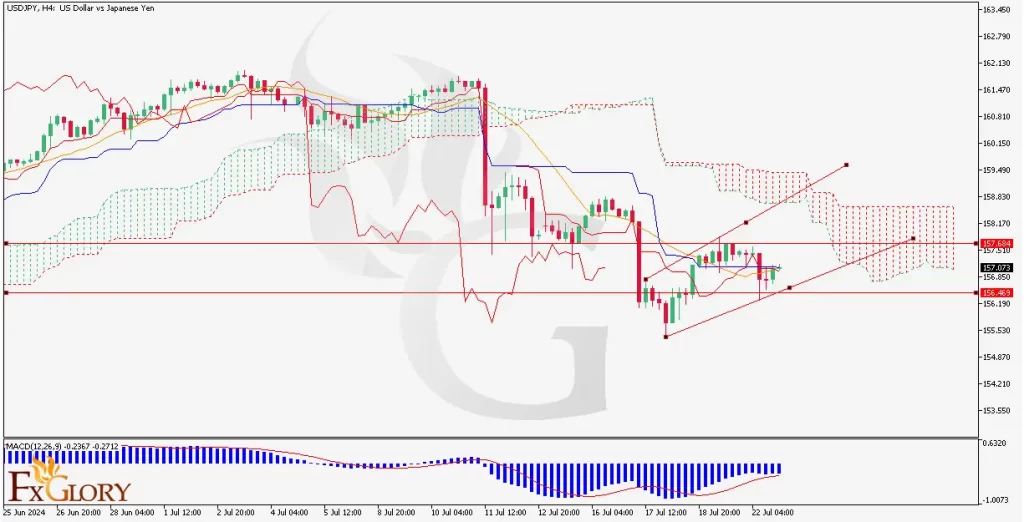
The USD/JPY H4 chart, shows the pair’s bearish trend, with recent price movements forming lower highs and lower lows. The USD/JPY pair, also known as the Gopher has its price currently trending below the Ichimoku Cloud, indicating a bearish sentiment. The pair has recently found support near 156.46 and resistance around 157.68. The formation of a descending channel suggests further downside potential unless there is a strong reversal signal.
Key Technical Indicators:
Ichimoku Cloud: The price is below the Ichimoku Cloud on USDJPY H4 chart, indicating a bearish trend. The Tenkan-sen is below the Kijun-sen , reinforcing the bearish outlook for this pair. The Chikou Span is also below the price, further confirming the bearish sentiment for USD against JPY.
MACD (Moving Average Convergence Divergence): The MACD line is below the signal line, and the histogram is negative, indicating bearish momentum. The recent contraction of the histogram suggests a potential weakening of the bearish momentum.
Support and Resistance:
Support Levels: The key support level is 156.46, which has been tested multiple times and has held.
Resistance Levels: The primary resistance level is at 157.68, with another significant level at 158.07.
Conclusion and Consideration:
The Gopher’s technical analysis on the H4 chart exhibits a strong bearish trend supported by the Ichimoku Cloud and MACD indicators. The USD/JPY price action suggests a continuation of the downward movement unless a significant reversal signal occurs. Traders should watch for any breakouts above the resistance level of 157.68 or below the support level of 156.46 for potential trade opportunities. It’s essential to monitor upcoming economic data releases for the USD and JPY, as these can impact the pair’s direction. As always, employing proper risk management strategies, including stop losses, is crucial in this volatile market.
Disclaimer: The provided analysis is for informational purposes only and does not constitute investment advice. Traders should conduct their own research and analysis before making any trading decisions.


