Time Zone: GMT +3
Time Frame: 4 Hours (H4)
Fundamental Analysis:
The EUR/USD forecast today is heavily influenced by the economic releases from Europe and the U.S. For the Euro, factors like the results from bond auctions by the General Secretariat of the Treasury and statements from the ECB provide key insights into fiscal health and monetary policy decisions. Upcoming ECB interest rate decisions and statements could affect the Euro’s strength. For the U.S., key data like unemployment claims and the Philly Fed Manufacturing Index serve as indicators of economic health, influencing the USD. Increased jobless claims could weaken the USD, whereas a positive manufacturing report could strengthen it.
Price Action:
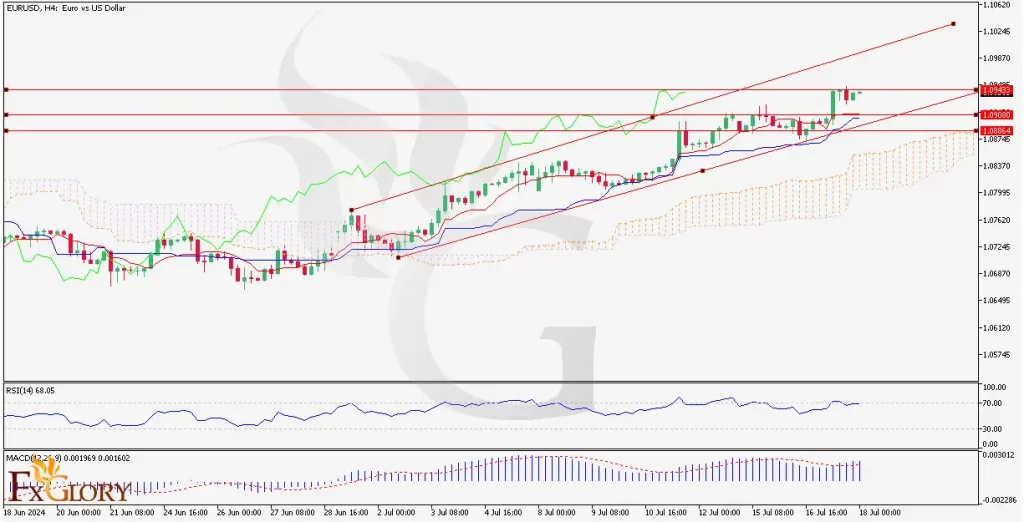
The EUR/USD H4 chart timeframe shows a narrowing ascending channel pattern, indicating a steady uptrend but with resistance nearing the upper channel line. The EUR/USD pair also known as the Fiber, still has its price above the Ichimoku cloud, suggesting the pair’s bullish market environment. However, the Fiber’s price action also shows resistance levels are being tested, indicating potential points where the price momentum might pause or reverse.
Key Technical Indicators:
Ichimoku Cloud: The price is above the Ichimoku Cloud, supporting the current bullish trend. However, the narrowing of the cloud could suggest upcoming volatility or a potential trend shift.
RSI (Relative Strength Index): The RSI is at 68.05, nearing the overbought territory, which could suggest a potential pullback or stabilization in price movements.
MACD (Moving Average Convergence Divergence): The MACD shows a slight divergence above its signal line, indicating bullish momentum but with caution as the histogram bars are small, suggesting a lack of strong momentum.
Support and Resistance:
Support Levels: The nearest support is observed at the lower boundary of the ascending channel and the Ichimoku Cloud, around 1.0884.
Resistance Levels: Immediate resistance is seen at the upper channel line and the recent high at 1.0938. A break above this could lead to further bullish movement towards the 1.1000 level.
Conclusion and Consideration:
The EUR/USD technical analysis today is displaying bullish signs on the H4 chart, supported by technical indicators like MACD and position above the Ichimoku Cloud. Traders should keep an eye on the resistance at 1.0938, as a breakout could confirm continued bullish trends. The EUR/USD fundamental analysis based on the recent events in the Eurozone and the U.S. could heavily influence the direction, so staying updated with these can be crucial for timely decision-making.
Disclaimer: The provided analysis is for informational purposes only and does not constitute investment advice. Traders should conduct their own research and analysis before making any trading decisions.


