Time Zone: GMT +2
Time Frame: 4 Hours (H4)
Fundamental Analysis:
BTC/USD reflects the interplay between Bitcoin and the US Dollar, influenced by a complex blend of factors. For Bitcoin, these include network adoption rates, regulatory news from major economies, technological advancements such as the implementation of upgrades (e.g., Taproot), and shifts in investor sentiment within the cryptocurrency space. For the USD, monetary policies set by the Federal Reserve, inflation rates, and economic data releases are pivotal. The dynamics between these factors can significantly impact Bitcoin’s valuation against the dollar.
Price Action:
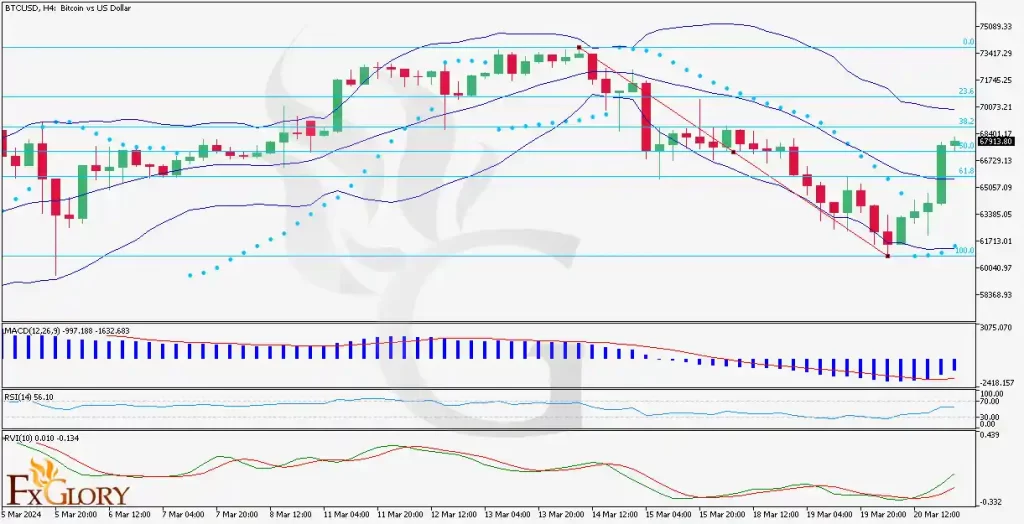
The H4 chart indicates that BTC/USD has been recovering from a downtrend, as evidenced by the recent series of higher lows and higher highs. This pattern suggests that bulls are attempting to regain control. The candles are currently clustered near a critical juncture, possibly foretelling an imminent decision point for further price movement.
Key Technical Indicators:
MACD: The MACD line is positioned above the signal line with a widening histogram, indicating strengthening bullish momentum.
RSI: The RSI value stands just above the mid-line at approximately 56, signaling neither overbought nor oversold conditions, with room for potential price movement in either direction.
RVI: The Relative Vigor Index shows a bullish crossover, which could be seen as a supportive signal for continued upward price momentum.
Bollinger Bands: Price action is nearing the upper Bollinger Band, suggesting that resistance may be encountered soon.
Parabolic SAR: The placement of the dots below the price candles signifies a bullish trend is currently in effect.
Fibonacci Retracement: The price has passed the 38.2% level, approaching the 50% retracement, indicating a possible area of resistance.
Support and Resistance:
Support: The recent swing low provides immediate support, aligning with the lower Bollinger Band, while the 0% Fibonacci retracement level stands as a crucial psychological support zone.
Resistance: The 50% Fibonacci retracement level presents immediate resistance, and a breach above could test the 61.8% level. The upper Bollinger Band may also act as a dynamic resistance in the short term.
Conclusion and Consideration:
The current technical posture of BTC/USD on the H4 chart leans toward the bullish side, as suggested by the MACD and Parabolic SAR indicators. However, approaching the 50% Fibonacci level could serve as a litmus test for the strength of the current recovery. Market participants should maintain vigilance over both technical resistance levels and fundamental developments that might influence market sentiment. As always, it is prudent to employ sound risk management strategies given the volatile nature of cryptocurrency markets.
Disclaimer: This analysis is for informational purposes only and does not constitute investment advice. Individuals should conduct their own research or consult a financial advisor before making any investment decisions.


