Time Zone: GMT +2
Time Frame: 4 Hours (H4)
Fundamental Analysis:
The CAD/JPY pair is influenced by economic indicators and policy decisions from both Canada and Japan. Key factors include changes in oil prices, which heavily influence the Canadian dollar, and Japan’s monetary policy, which affects the yen. Market sentiment toward global risk also plays a role, as the yen is considered a safe-haven currency.
Price Action:
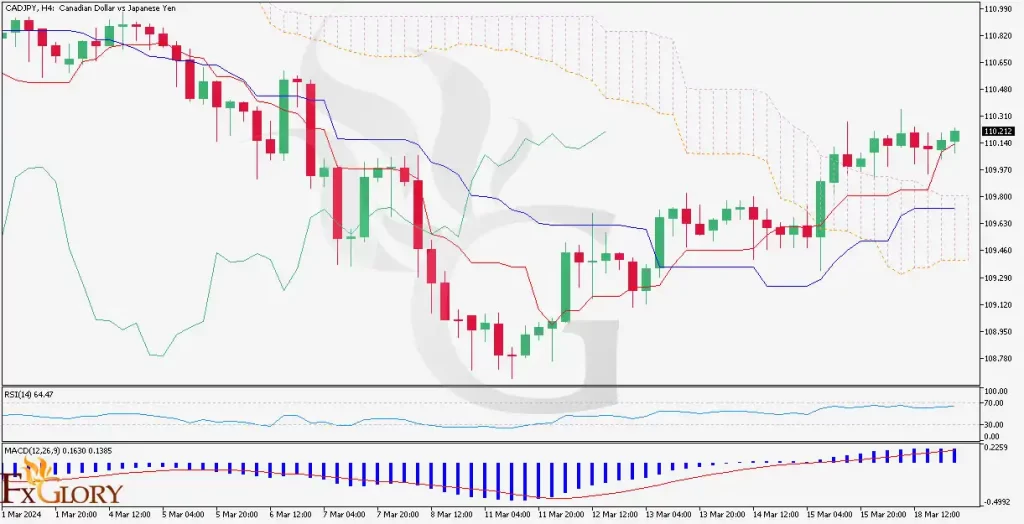
On the H4 chart for CAD/JPY, the pair shows a tendency to move upward, evidenced by the formation of higher lows and higher highs. The recent price action indicates a bullish sentiment, with candles trending above the Ichimoku Cloud.
Key Technical Indicators:
RSI (Relative Strength Index): The RSI is hovering around 64, suggesting a strong upward momentum without being overbought, which could indicate the trend may continue.
MACD (Moving Average Convergence Divergence): The MACD line is above the signal line, and the histogram is in positive territory, both signaling bullish momentum.
Ichimoku Cloud: The price is above the cloud, and the cloud is trending upwards, typically suggesting a bullish trend.
Support and Resistance:
Support: The recent higher low on the chart acts as the nearest support level, with further support potentially from the top boundary of the Ichimoku Cloud.
Resistance: The current price is approaching the recent high, which could act as resistance. A break above this level might suggest a continuation of the uptrend.
Conclusion and Consideration:
The CAD/JPY H4 chart presents a bullish outlook, supported by the price action and technical indicators. The MACD indicates sustained bullish momentum, while the RSI suggests there’s room for the uptrend to continue before reaching overbought conditions. Traders may consider looking for buy signals, particularly if the price breaks above the current resistance, keeping in mind that shifts in oil prices and risk sentiment could significantly impact the trend. Employing prudent risk management remains essential.
Disclaimer: This analysis is informational and does not constitute investment advice. Traders should do their own research before making any trading decisions.


