Time Zone: GMT +2
Time Frame: 4 Hours (H4)
Fundamental Analysis:
In today’s BTC-USD H4 technical and fundamental analysis, market attention is focused on multiple Federal Reserve speakers, including Chicago Fed President Austan Goolsbee, San Francisco Fed President Mary Daly, Boston Fed President Susan Collins, Cleveland Fed President Beth Hammack, and Philadelphia Fed President Anna Paulson. Their speeches may provide signals about the future direction of US monetary policy and interest rates. A hawkish tone supporting higher interest rates could strengthen the US Dollar and pressure Bitcoin, while a more dovish outlook could support risk assets including cryptocurrencies. Additionally, traders remain attentive to upcoming US labor market and consumer spending indicators such as Non-Farm Payrolls, Retail Sales, and the Unemployment Rate, which are key signals of economic strength and inflation trends. These factors may influence volatility in the ongoing BTC/USD technical and fundamental daily chart analysis.
Price Action:
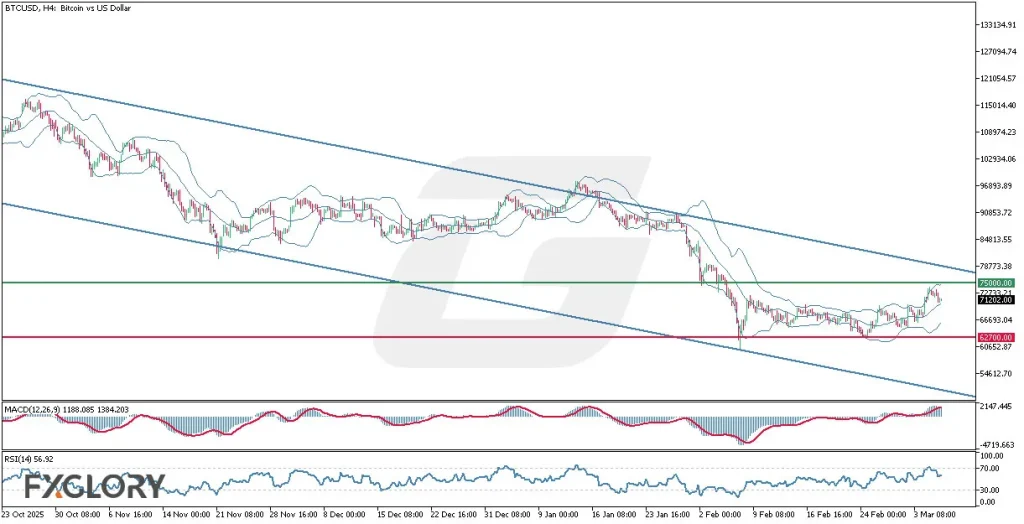
The BTC-USD H4 price action analysis shows that Bitcoin has been ranging below the $75,000 resistance level since February, indicating a consolidation phase after the previous decline. Recently, the price has been trading in the upper half of the Bollinger Bands, moving between the upper and middle bands, suggesting mild bullish momentum. The market previously reacted strongly from the $62,700 support, confirming it as an important demand zone. However, BTC/USD is still moving within a descending price channel that has guided the trend since 2025, which continues to limit stronger bullish continuation. As long as the price holds above the $70,000 area, short-term momentum may remain slightly positive in the ongoing BTC USD H4 technical price action analysis.
Key Technical Indicators:
Bollinger Bands: The price is trading in the upper half of the Bollinger Bands, fluctuating between the upper and middle bands. The middle band around $70,000 acts as dynamic support for the current move.
MACD (Moving Average Convergence Divergence): The MACD (12,26,9) is around 1188.085 and 1384.203, with the MACD line above the signal line. This suggests moderate bullish momentum in the short term.
RSI (Relative Strength Index): The RSI (14) currently stands at 56.92, reflecting neutral-to-bullish momentum. This level indicates there is still room for additional upward movement before reaching overbought conditions.
Support and Resistance:
Support: Immediate support is located around $70,000, which aligns with the psychological level and the middle Bollinger Band.
Resistance: The nearest resistance level is at $75,000, which has capped Bitcoin’s price movement since February.
Conclusion and Consideration:
The BTCUSD H4 technical and fundamental chart analysis shows a short-term recovery within a broader descending channel structure. While indicators such as MACD and RSI suggest moderate bullish momentum, the $75,000 resistance remains a key barrier for further upside. Traders following the BTCUSD H4 price action and daily crypto technical analysis should monitor macroeconomic developments and Federal Reserve speeches, as these events could increase market volatility.
Disclaimer: The analysis provided for BTC/USD is for informational purposes only and does not constitute investment advice. Traders are encouraged to perform their own analysis and research before making any trading decisions on BTCUSD. Market conditions can change quickly, so staying informed with the latest data is essential.