Time Zone: GMT +2
Time Frame: 4 Hours (H4)
Fundamental Analysis:
The ETHUSD pair (Ethereum against the US Dollar) is currently trading within a mixed market sentiment environment influenced by delayed economic data releases from the US due to the recent government shutdown. Upcoming releases include the Core Producer Price Index (Core PPI), general PPI, Chicago PMI, and Construction Spending, all essential indicators that could heavily impact USD valuation. Positive surprises in these metrics typically strengthen the USD and could lead to bearish pressure on Ethereum prices, while weaker-than-expected data might provide support for ETH-USD, fueling bullish sentiments.
Price Action:
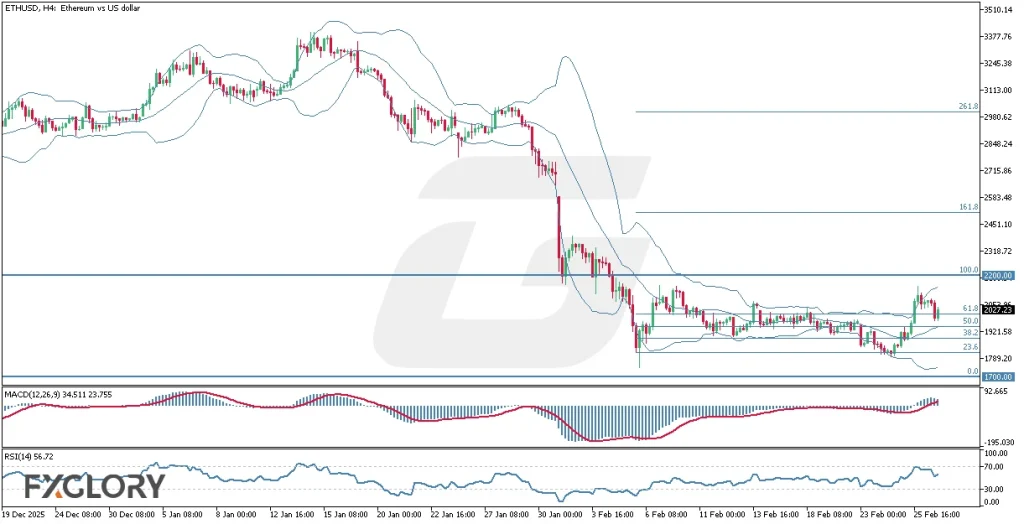
The ETHUSD H4 technical and fundamental chart daily analysis highlights a ranging market where Ethereum price action is consolidating around the 2,000 USD psychological level within approximately ±300 USD. Neither bulls nor bears currently dominate the market. Ethereum’s price recently touched the upper half of the Bollinger Band, retracing toward the middle band positioned near the 50.0% Fibonacci level. However, the recent candle turned green close to the Fibonacci retracement region, signaling indecision yet mild bullish resilience within the current consolidation phase.
Key Technical Indicators:
Bollinger Bands: Analyzing ETHUSD H4 using Bollinger Bands indicates the price is moving in the upper half but retreating towards the midline (50.0% Fibonacci retracement area). Such movement typically signifies a temporary pause or consolidation, with potential ranging behavior continuing until a decisive breakout occurs.
MACD(12,26,9):The MACD indicator currently registers a MACD line value of 34.511 and a signal line at 23.755, suggesting mild bullish momentum. However, given the close proximity of these lines, traders should monitor closely for potential bearish crossovers, indicating a momentum shift to the downside.
RSI(14): The RSI indicator stands at 56.72, reflecting moderate bullish strength without entering the overbought territory. This level confirms neutrality with a slightly bullish bias, suggesting room for price movements in both directions and supporting the current range-bound scenario.
Support and Resistance:
Support: The immediate technical support for ETHUSD is found near the 1,700 price area, aligning with recent lows and the lower Bollinger Band boundary.
Resistance: Primary resistance resides at the 2,200 level, aligning with recent swing highs and the upper end of the current trading range.
Conclusion and Consideration:
The ETHUSD H4 technical analysis indicates a ranging market condition, confirmed by neutral signals from Bollinger Bands, MACD, and RSI indicators. Traders should closely monitor the upcoming economic data releases affecting the USD for potential breakouts. Until ETHUSD clearly surpasses the key resistance level at 2,200 or breaks below the 1,700 support, price action is likely to remain range-bound. Caution is advised as market conditions may quickly shift with significant economic data announcements.
Disclaimer: The analysis provided for ETH/USD is for informational purposes only and does not constitute investment advice. Traders are encouraged to perform their own analysis and research before making any trading decisions on ETHUSD. Market conditions can change quickly, so staying informed with the latest data is essential.