Time Zone: GMT +2
Time Frame: 4 Hours (H4)
Fundamental Analysis:
The USD/JPY currency pair reflects current market expectations shaped significantly by upcoming US economic releases, including Jobless Claims data from the Department of Labor and Federal Reserve Governor Michelle Bowman’s testimony on bank regulation. A lower-than-forecast number in Jobless Claims could strengthen the USD by indicating a healthier labor market and improved consumer spending potential. Governor Bowman’s speech may also affect the USD, as any hints towards hawkish monetary policy could support dollar appreciation. Meanwhile, the JPY is influenced by the upcoming Tokyo CPI excluding fresh food, Industrial Production, and Retail Trade data. Higher-than-forecast outcomes in these indicators could boost the yen, reflecting stronger economic conditions and potential monetary tightening by the Bank of Japan.
Price Action:
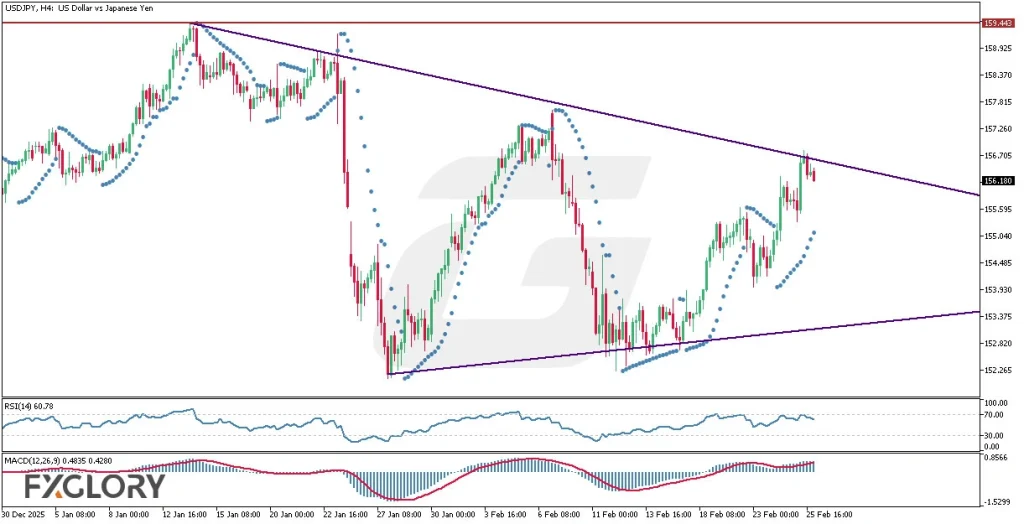
The USDJPY analysis on the H4 timeframe suggests a recent bearish trend following a high at 159.443. The candles have demonstrated extended correction phases, forming a distinct bullish pennant pattern. After completing the latest upward correction, the price has resumed its downward movement, likely targeting the lower boundary of the bullish pennant. Once this support level is tested, a bullish continuation could emerge, reflecting price stability within the pennant formation.
Key Technical Indicators:
Parabolic SAR: The indicator dots are currently below the candles, signifying bullish sentiment in the short term. Traders should watch for a potential reversal if the dots switch position above the price action, signaling a bearish turnaround.
RSI (14): The RSI stands at 60.78, indicating moderate bullish strength but far from overbought conditions. This implies potential room for upward movements but with caution for temporary pullbacks as it moves closer to resistance levels.
MACD (12,26,9): MACD displays a value of 0.4835, slightly above its signal line at 0.4280, suggesting weakening bullish momentum. The narrowing histogram bars signal possible consolidation or impending bearish momentum, advising traders to prepare for potential shifts in price direction.
Support and Resistance:
Support: Immediate support lies around the lower boundary of the bullish pennant, near the 153.930 level, aligning with recent price corrections.
Resistance: The closest resistance is at 156.705, corresponding to the upper boundary of the bullish pennant pattern and recent highs.
Conclusion and Consideration:
The USDJPY H4 chart indicates potential bullish continuation after testing the lower boundary of the bullish pennant. Technical indicators like RSI and Parabolic SAR reflect ongoing bullish bias, but the MACD hints at decreasing momentum, suggesting caution for traders. Due to upcoming economic announcements and volatility concerns from both the US and Japan, traders should remain vigilant and monitor support and resistance levels closely for more accurate entry and exit strategies.
Disclaimer: The analysis provided for USD/JPY is for informational purposes only and does not constitute investment advice. Traders are encouraged to perform their own analysis and research before making any trading decisions on USDJPY. Market conditions can change quickly, so staying informed with the latest data is essential.