Time Zone: GMT +2
Time Frame: 4 Hours (H4)
Fundamental Analysis:
The AUD/USD currency pair is facing potential volatility today with critical economic releases scheduled for both Australia and the United States. Australia’s monthly Consumer Price Index (CPI) figures, including core CPI, are expected to influence market sentiment significantly, especially given their implications for future Reserve Bank of Australia (RBA) monetary policy decisions. Simultaneously, the US dollar may also experience volatility with upcoming speeches from several Federal Reserve members, including Richmond President Thomas Barkin and Kansas City President Jeffrey Schmid, whose insights into the Federal Open Market Committee’s (FOMC) monetary policy outlook will be closely monitored by traders.
Price Action:
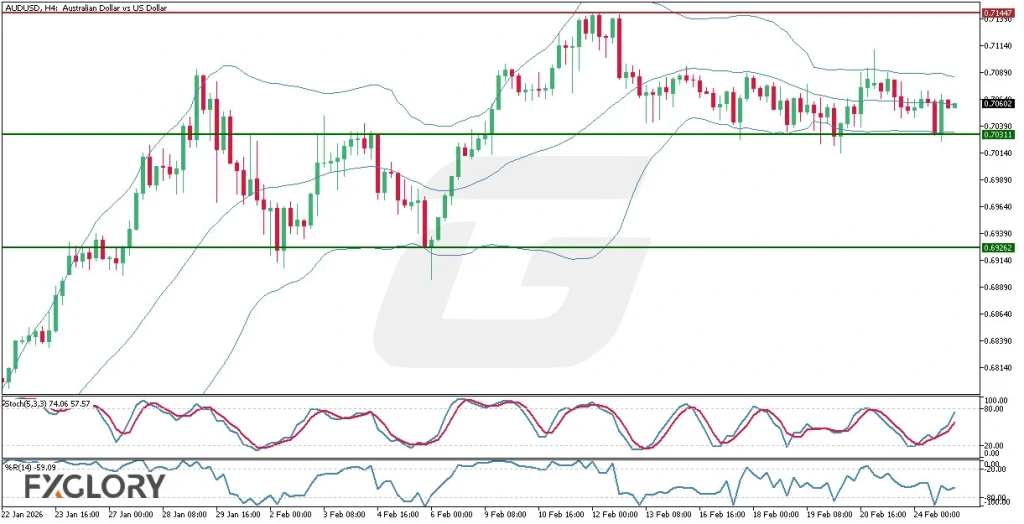
The AUDUSD H4 chart has maintained a prolonged bullish trend, recently testing the significant historical resistance at 0.71447. However, recent price action demonstrates market indecision, characterized by the formation of a tweezer top candlestick pattern at this resistance level, signaling potential bearish reversal signals. If bearish momentum continues, the pair may retest lower support levels at 0.70311 and 0.69262. Traders should closely monitor these levels for further signs of price rejection or breakout confirmations.
Key Technical Indicators:
Bollinger Bands (30): The Bollinger Bands have noticeably narrowed, suggesting a period of consolidation. Typically, a narrowing range indicates reduced volatility, often followed by an expansion, which could signal a potential significant price move. Traders should watch closely for a breakout beyond the bands as confirmation of trend direction.
Stochastic (5,3,3): Currently at 74.06 and 57.57, the Stochastic oscillator indicates declining bullish momentum as it moves downward from overbought territory. This suggests the potential onset of bearish pressure, reinforcing the idea of a possible reversal from the current resistance area.
Williams’ Percentage Range (14): At -59.09, the Williams’ %R reflects a neutral market stance, although it has been edging toward oversold territory. This reading aligns with the view of potential bearish sentiment building up, warranting caution from buyers.
Support and Resistance:
Support: Immediate support is located at 0.70311, with a further critical level at 0.69262, both representing historical pivot areas.
Resistance: The primary resistance level remains firmly set at 0.71447, a historically robust barrier.
Conclusion and Consideration:
AUDUSD’s technical and fundamental daily chart analysis shows clear signs of a potential shift in market sentiment from bullish to bearish. Key technical indicators, including Bollinger Bands, Stochastic Oscillator, and Williams’ Percentage Range, highlight emerging bearish pressure following the recent indecision at the critical resistance level of 0.71447. Traders should remain vigilant and consider upcoming CPI data releases from Australia and Fed speeches from the US as potential catalysts for increased volatility.
Disclaimer: The analysis provided for AUD/USD is for informational purposes only and does not constitute investment advice. Traders are encouraged to perform their own analysis and research before making any trading decisions on AUDUSD. Market conditions can change quickly, so staying informed with the latest data is essential.