Time Zone: GMT +2
Time Frame: 4 Hours (H4)
Fundamental Analysis:
The NZDUSD currency pair is anticipated to show significant market movements today driven by key economic events from New Zealand and the United States. The Reserve Bank of New Zealand’s latest credit card spending data release is crucial, as increased consumer spending typically reflects heightened consumer confidence, potentially strengthening the NZD. Conversely, attention will also focus on the US Federal Reserve Governor Christopher Waller’s discussion on “Economic Outlook and Monetary Policy,” where hawkish statements might enhance the attractiveness of the USD. Additionally, upcoming US manufacturing purchase orders data could further impact the USD by signaling future manufacturing activities.
Price Action:
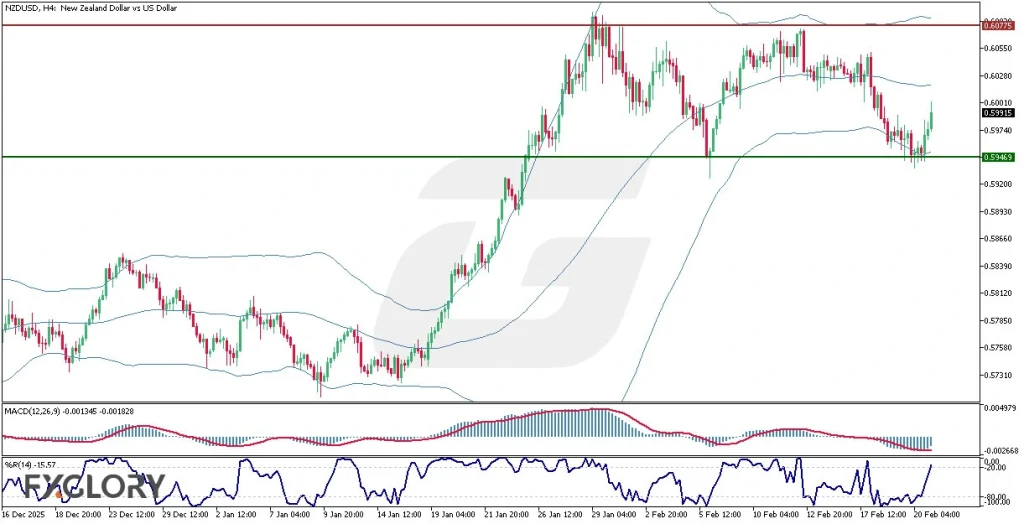
The NZDUSD H4 chart illustrates recent price movements within strong support and resistance zones between 0.59469 and 0.60775. Following multiple attempts, the price has recently rebounded from the established support at 0.59469, indicating strong buying interest and bullish momentum. Candlestick formations currently demonstrate an upward trajectory, suggesting that buyers might soon challenge the resistance level at 0.60775. Given the prevailing bullish trend on the chart, a breakout above the resistance level remains a plausible scenario.
Key Technical Indicators:
Bollinger Bands (65): The Bollinger Bands have recently expanded, reflecting increased volatility. However, traders might anticipate a narrowing of the bands soon, signifying potential consolidation or reduced volatility before the next significant move occurs. Observing price actions relative to the bands will provide clearer directional signals.
MACD (12,26,9): MACD currently reads -0.001345 below the signal line at -0.001828, suggesting a minor bearish sentiment recently. Nevertheless, the declining histogram indicates that bearish momentum is diminishing, setting the stage for a possible bullish crossover. Traders should closely monitor this indicator for signs of an emerging bullish trend.
Williams’ %R (14): Williams’ %R currently stands at -15.57, reflecting the currency pair’s strong buying pressure and proximity to overbought conditions. Although this supports the current bullish outlook, caution is advised as the price may soon require a minor correction or consolidation.
Support and Resistance:
Support: Solid support at 0.59469, confirmed by recent price rebounds.
Resistance: Immediate resistance at 0.60775, a critical level challenging bullish momentum.
Conclusion and Consideration:
The NZDUSD H4 technical and fundamental daily chart analysis indicates a predominantly bullish outlook, reinforced by price action and key technical indicators. Traders should remain vigilant around the significant resistance at 0.60775, watching for breakout confirmations or potential reversals. Given today’s economic data releases and discussions from central bank figures, volatility is anticipated to increase significantly, influencing market movements in either direction.
Disclaimer: The analysis provided for NZD/USD is for informational purposes only and does not constitute investment advice. Traders are encouraged to perform their own analysis and research before making any trading decisions on NZDUSD. Market conditions can change quickly, so staying informed with the latest data is essential.