Time Zone: GMT +2
Time Frame: 4 Hours (H4)
Fundamental Analysis:
The BTC/USD pair represents Bitcoin priced against the US Dollar. Today’s fundamental landscape for USD includes critical economic data releases such as the Automatic Data Processing (ADP) employment figures, the New York Manufacturing Index, and speeches from Federal Reserve officials. Positive outcomes in these indicators, especially employment figures and manufacturing outlook, typically strengthen the USD, potentially exerting bearish pressure on BTC/USD. Traders must remain cautious around the timing of these news events, anticipating increased volatility.
Price Action:
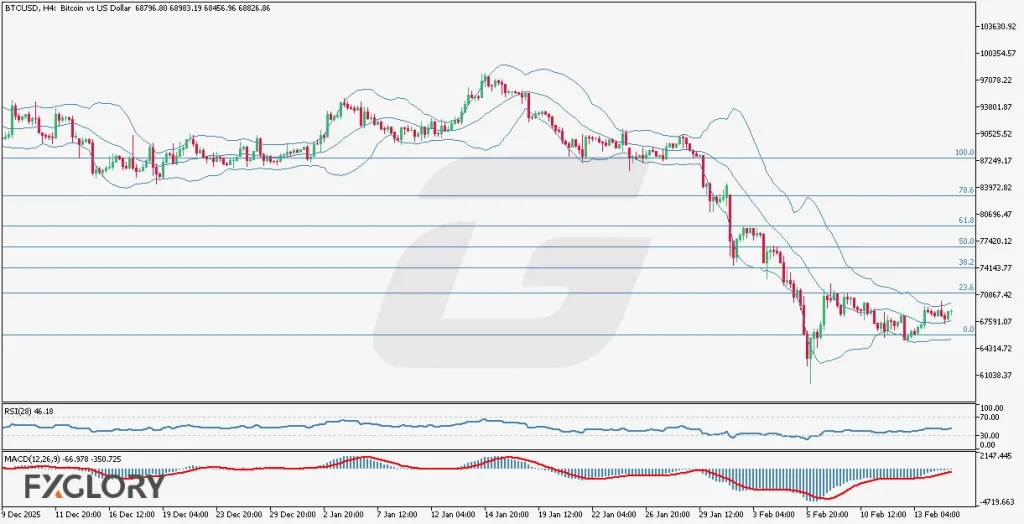
Analyzing BTC/USD price action on the H4 timeframe reveals a current bullish consolidation pattern. After touching the lower Bollinger Band and the 0% Fibonacci retracement level, BTC/USD has rebounded, stabilizing into a slight horizontal movement with a gentle bullish bias. The price action now sits within the upper half of the Bollinger Bands channel, suggesting potential bullish continuation if volatility returns.
Key Technical Indicators:
Bollinger Bands: The Bollinger Bands have contracted significantly, indicating a period of low volatility that usually precedes a decisive breakout. The current BTC-USD price resides in the upper half, suggesting bullish sentiment, yet traders should monitor for band expansion signaling the next directional move.
MACD (Moving Average Convergence Divergence): MACD readings are negative at -66.976, with the signal line at -350.725, indicating bearish dominance but also a diminishing bearish momentum. Traders should watch closely for a bullish crossover, which could confirm upward price potential.
RSI (Relative Strength Index): RSI is currently neutral at 46.18, highlighting balanced market conditions. The indicator neither shows overbought nor oversold scenarios, which supports the possibility of continued sideways movement with a mild bullish inclination.
Support and Resistance:
Support: Immediate support for BTC/USD is located around the recent lows near the 0% Fibonacci level at approximately $67,590.
Resistance: The nearest significant resistance is at the 23.6% Fibonacci retracement level near $70,860, which previously acted as a price pivot.
Conclusion and Consideration:
BTC-USD’s H4 chart suggests a cautious bullish outlook amid low volatility. Technical indicators reflect balanced market sentiment, awaiting a clearer directional trigger from upcoming USD news releases. Traders should remain vigilant for breakout signals as tightening Bollinger Bands typically forecast imminent volatility. Caution is advised due to potentially increased USD volatility following today’s economic announcements.
Disclaimer: The analysis provided for BTC/USD is for informational purposes only and does not constitute investment advice. Traders are encouraged to perform their own analysis and research before making any trading decisions on BTCUSD. Market conditions can change quickly, so staying informed with the latest data is essential.