Time Zone: GMT +2
Time Frame: 4 Hours (H4)
Fundamental Analysis:
The GOLD (XAU/USD) H4 technical and fundamental analysis is heavily influenced today by high-impact USD news, particularly speeches from Federal Reserve Bank of Dallas President Lorie Logan and Federal Reserve Governor Stephen Miran, both FOMC voting members. Any hawkish tone regarding future interest rate hikes or persistent inflation could strengthen the US Dollar and pressure XAU/USD prices lower, as higher yields reduce the appeal of non-yielding assets like gold. Additionally, the delayed US CPI and Core CPI releases remain a key macro driver, as inflation data directly impacts Federal Reserve monetary policy expectations. Stronger-than-forecast inflation would likely boost USD demand and weigh on gold prices, while softer inflation could support a bullish breakout in the GOLD H4 chart analysis. Therefore, today’s XAU/USD H4 forecast depends significantly on USD volatility and forward guidance from Federal Open Market Committee officials.
Price Action:
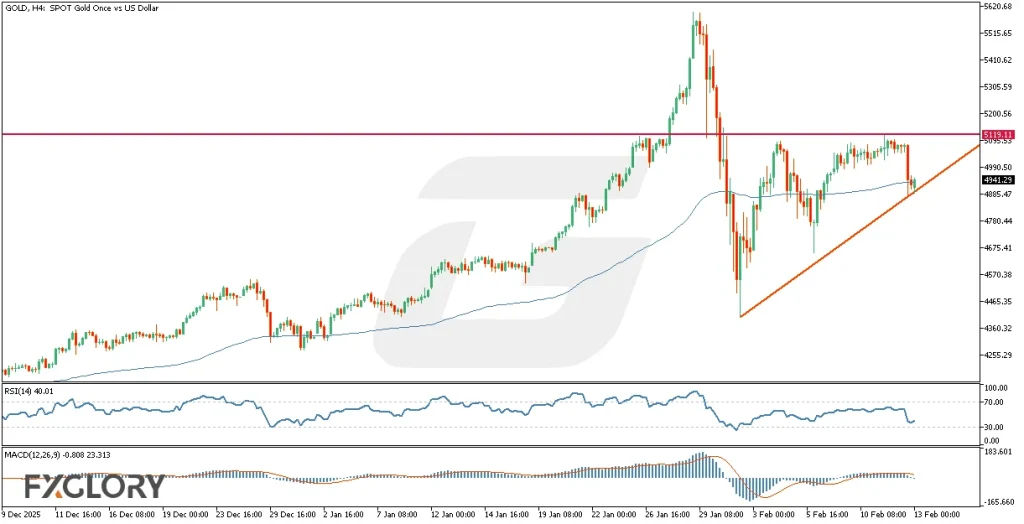
The XAU/USD H4 price action analysis shows that gold is forming higher lows while facing horizontal resistance around the 5100–5120 area, creating a potential ascending triangle pattern on the H4 timeframe. The ascending trend line has been tested three times, and the latest rebound from this dynamic support suggests buyers are defending the structure again. After touching the trend line, the last H4 candle closed bullish (green), indicating short-term buying interest. However, the heavy horizontal resistance zone near 5100–5120 remains a strong supply area, making this GOLD H4 technical chart setup a compression phase before a potential breakout or rejection.
Key Technical Indicators:
Adaptive Moving Average (20,9,21): Price is interacting closely with the Adaptive MA, with the last three H4 candles touching and slightly crossing it. This suggests weakening bearish pressure and a possible short-term bullish shift. Holding above the MA supports continuation toward the 5100–5120 resistance zone in the GOLD (XAU/USD) H4 technical analysis.
RSI (14): The RSI is at 40.01 after rebounding from near 30, indicating recovery from oversold conditions. Momentum is improving but remains below the neutral 50 level. A move above 50 would strengthen bullish confirmation in this XAU/USD H4 chart forecast.
MACD (12,26,9): The MACD remains slightly negative (-0.808) but shows fading bearish momentum with a stabilizing histogram. This signals potential for a bullish crossover if buying pressure continues. Overall, momentum is shifting gradually in favor of buyers on the H4 timeframe.
Support and Resistance:
Support: The ascending trend line around the 4880–4900 area acts as immediate dynamic support, reinforced by recent higher lows and moving average confluence.
Resistance: The major horizontal resistance is located in the 5100–5120 zone, a strong supply area that has capped price multiple times on the H4 GOLD chart.
Conclusion and Consideration:
The GOLD (XAU/USD) H4 technical and fundamental daily chart analysis suggests a compression structure within an ascending triangle pattern, supported by higher lows and repeated trend line defenses. Technical indicators such as RSI recovery, weakening MACD bearish momentum, and price interaction with the Adaptive MA favor a potential bullish breakout scenario. However, the 5100–5120 resistance remains a critical barrier, and upcoming USD news from FOMC members and inflation expectations could trigger volatility spikes. A hawkish Federal Reserve tone may strengthen the USD and pressure gold lower, while dovish commentary could fuel a breakout above resistance.
Disclaimer: The analysis provided for GOLD /USD is for informational purposes only and does not constitute investment advice. Traders are encouraged to perform their own analysis and research before making any trading decisions on GOLDUSD. Market conditions can change quickly, so staying informed with the latest data is essential.