Time Zone: GMT +2
Time Frame: 4 Hours (H4)
Fundamental Analysis:
The GBP/USD currency pair is influenced today by key economic indicators from both the UK and the US. BOE MPC member Catherine Mann is scheduled to speak at a Global Interdependence Center conference; her remarks could offer clues regarding future UK monetary policy, potentially causing volatility in GBP pairs. Additionally, the British Retail Consortium (BRC) retail sales report will shed light on consumer spending in the UK, affecting GBP strength. On the US side, several crucial indicators will be released, including NFIB Small Business Index, ADP Employment data, Retail Sales, Import Prices, and speeches from FOMC members Beth Hammack and Lorie Logan, providing vital insights into the US economic outlook and influencing USD demand.
Price Action:
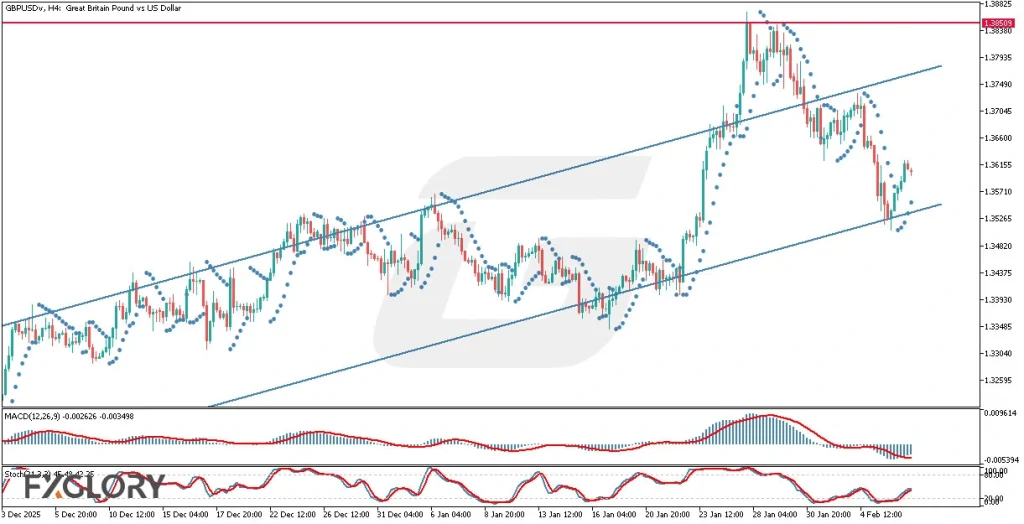
The GBPUSD pair analysis on the H4 timeframe had been moving along a bullish channel until recently, when candles broke out of the upper channel boundary, marking a significant resistance at 1.38509, the highest level observed recently. Following this breakout, the price retreated sharply, moving downward and touching the lower boundary of the ascending channel. Given the current bearish momentum observed in recent candlestick formations, the likelihood of the bullish trend resuming strongly is limited. Price action suggests cautious market sentiment with potential for further tests of channel support.
Key Technical Indicators:
Parabolic SAR: The Parabolic SAR indicator dots have appeared below the candles, indicating a potential bullish reversal signal. However, this needs further confirmation as the current bearish pressure might limit immediate bullish momentum.
MACD (12, 26, 9): The MACD indicator currently reads -0.002626 below its signal line at -0.003498, suggesting ongoing bearish momentum. The narrowing histogram bars indicate a weakening of this bearish momentum, suggesting a possible shift in market sentiment in upcoming sessions.
Stochastic (21, 3, 3): The Stochastic oscillator currently at 45.48 and 42.25 reflects moderate market conditions, neither overbought nor oversold. This neutral position indicates a consolidation phase, allowing traders to wait for clearer directional cues before entering new positions.
Support and Resistance:
Support: Immediate support lies along the lower channel boundary near 1.35250.
Resistance: Strong resistance is clearly defined at the recent high of 1.38509.
Conclusion and Consideration:
The GBPUSD H4 chart indicates a complex scenario. Despite recent bearish candles suggesting weaker bullish sentiment, indicators like Parabolic SAR hint at potential reversal opportunities. MACD signals weakening bearish momentum, and Stochastic indicates neutral market conditions. Traders should remain cautious due to the upcoming impactful fundamental data from both GBP and USD sides, which can significantly affect volatility and market direction.
Disclaimer: The analysis provided for GBP/USD is for informational purposes only and does not constitute investment advice. Traders are encouraged to perform their own analysis and research before making any trading decisions on GBPUSD. Market conditions can change quickly, so staying informed with the latest data is essential.