Time Zone: GMT +2
Time Frame: 4 Hours (H4)
Fundamental Analysis:
BTCUSD is currently influenced by USD-related economic indicators due to upcoming releases such as the ADP Non-Farm Employment Change, Services PMI from S&P Global, ISM Non-Manufacturing PMI, and crude oil inventories from API and EIA. Positive economic data from ADP, PMI, and crude oil inventory reports would strengthen the USD, potentially exerting downward pressure on BTCUSD. Conversely, weaker-than-expected data could provide bullish support for BTCUSD, as a weaker dollar typically boosts crypto market sentiment.
Price Action:
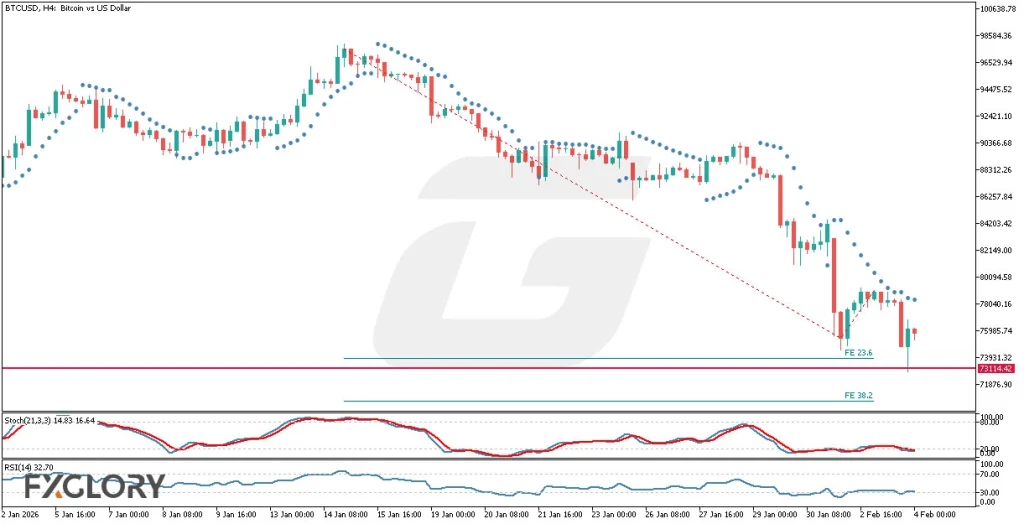
Despite the long-term bullish trend, BTCUSD has been in a sharp bearish correction on the H4 timeframe. Recently, price action has reached the significant historical support level at 73114.42. Candlestick patterns at this level suggest potential market hesitation, indicating the possibility of a reversal or a temporary consolidation. Traders should closely monitor the price response around this critical zone for potential bullish recovery signs.
Key Technical Indicators:
Parabolic SAR: The Parabolic SAR dots are consistently above the recent candles, confirming a strong bearish trend. Traders should remain cautious, awaiting a reversal signal from this indicator to confirm any potential bullish trend.
Stochastic (21,3,3): Currently at levels 14.83 and 16.64, the stochastic oscillator is significantly oversold, indicating a high possibility of a bullish reversal or short-term upward correction. Traders could look for crossover signals for entry points.
RSI (14): The RSI indicator stands at 32.70, close to oversold territory but not fully into it, suggesting that downward momentum is still present but weakening. Any upward reversal from here might confirm bullish intentions.
Support and Resistance:
Support: Strong historical support lies at 73114.42, providing a crucial floor that could stimulate buyer interest.
Resistance: Fibonacci expansion levels at 23.6 and 38.2 (approximately at 73931.32 and slightly lower) will serve as potential resistance points from where a bullish reversal could initiate.
Conclusion and Consideration:
The BTCUSD H4 chart currently exhibits strong bearish momentum but stands at a pivotal support level, backed by oversold stochastic readings and weakening RSI momentum. Traders should closely watch price behavior at 73114.42 for bullish reversal patterns or confirmations from Parabolic SAR and Stochastic indicators. Upcoming USD economic indicators might lead to heightened volatility; thus, risk management remains essential.
Disclaimer: The analysis provided for BTC/USD is for informational purposes only and does not constitute investment advice. Traders are encouraged to perform their own analysis and research before making any trading decisions on BTCUSD. Market conditions can change quickly, so staying informed with the latest data is essential.