Time Zone: GMT +2
Time Frame: 4 Hours (H4)
Fundamental Analysis:
GOLD (XAU/USD) remains under pressure amid key macroeconomic uncertainties and anticipated US economic data. Today’s USD-related events include speeches from FOMC members Thomas Barkin and Michelle Bowman, both of which may inject volatility if any hawkish rhetoric arises. The U.S. economy also faces potential delays in economic data releases due to the ongoing government shutdown risks. Job-related figures like JOLTS and consumer sentiment via RCM/TIPP could impact USD strength, indirectly influencing gold prices. Rising job openings or upbeat consumer confidence would bolster the USD, potentially weakening gold as higher yields become more attractive relative to non-yielding assets like gold. Caution is warranted as traders monitor these events for signals on future interest rate trajectories.
Price Action:
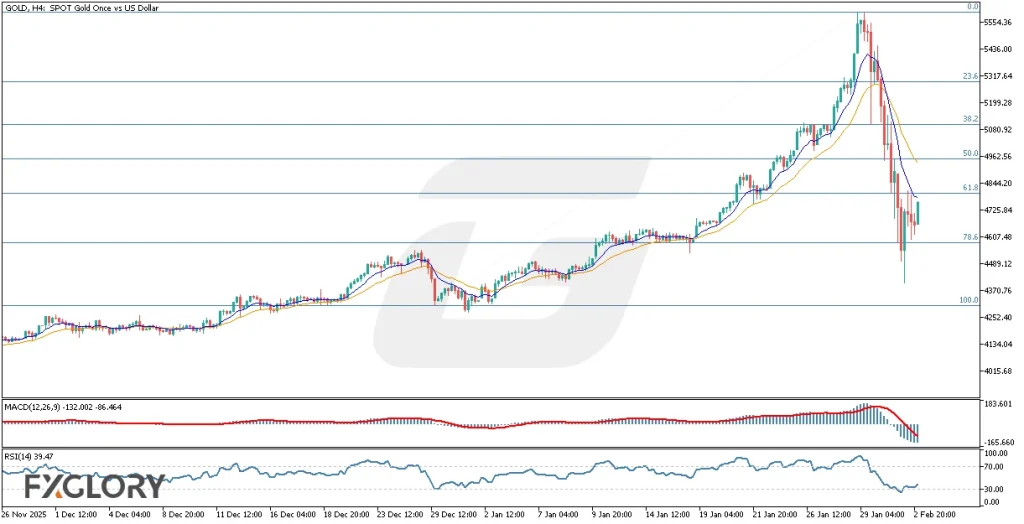
Gold (GOLD-USD) on the H4 timeframe shows a steep correction after touching an all-time high of approximately $5,597. The price collapsed over 1,100 points to the $4,400 level within just 14 H4 candles, marking a sharp and aggressive bearish move. Recently, price action shows a rebound from the 78.6% Fibonacci level around $4,580, attempting to test the 61.8% level near $4,800. However, bearish pressure remains dominant, and the overall trend remains bearish below the key moving averages. Unless a firm break and close above $4,800–$4,950 is achieved, the downtrend scenario could persist.
Key Technical Indicators:
Moving Averages (MA): The 9-period short-term moving average (blue) has decisively crossed below the longer-term moving average (orange), both trending downward. This crossover confirms the recent bearish momentum. Despite the minor upward correction, the downtrend remains intact as long as the price remains below both moving averages.
MACD (12,26,9): The MACD indicator is currently negative with a MACD line at -132.002 and signal line at -86.464. The histogram shows reduced bearish momentum, indicating a possible slowing of the downtrend. However, no bullish crossover has yet occurred, suggesting the recovery might be temporary unless further upside confirmation is seen.
RSI (14): The RSI is currently at 39.47, having bounced back from near oversold territory around 30. This reflects some relief buying, but still suggests bearish bias as it remains below the neutral 50 line. A break above 50 could indicate a shift in sentiment, but for now, sellers remain in control.
Support and Resistance:
Support: Near-term support is observed around $4,400, aligned with the recent low and just below the 78.6% Fibonacci retracement level. A break below this level could open the path toward the 100% retracement zone near $4,300.
Resistance: Immediate resistance lies around $4,800 (61.8% Fibonacci), followed by a stronger resistance at $5,000–$4,950 (50.0% Fibonacci). These levels will be critical in assessing any potential reversal.
Conclusion and Consideration:
GOLD (XAU/USD) remains in a technically bearish posture on the H4 chart despite a recent correction bounce. The downward crossover of moving averages, negative MACD, and an RSI below 50 all signal continued downside risk unless a strong breakout above $4,950 occurs. From a fundamental standpoint, USD volatility today may rise due to FOMC speeches and job data, which could further influence gold’s short-term trajectory. Traders should closely monitor reactions near key Fibonacci levels for breakout or rejection signals before entering new positions.
Disclaimer: The analysis provided for GOLD/USD is for informational purposes only and does not constitute investment advice. Traders are encouraged to perform their own analysis and research before making any trading decisions on GOLDUSD. Market conditions can change quickly, so staying informed with the latest data is essential.