Time Zone: GMT +2
Time Frame: 4 Hours (H4)
Fundamental Analysis:
The USDCAD currency pair, representing the exchange rate between the US Dollar (USD) and the Canadian Dollar (CAD), is influenced by several key economic indicators. Traders should closely monitor today’s scheduled economic announcements for the EUR and USD, as volatility in the USD often impacts this pair significantly. Economic conditions such as interest rate decisions, GDP reports, and employment data releases for the USD and CAD currencies could lead to substantial fluctuations, influencing traders’ sentiment and market direction.
Price Action:
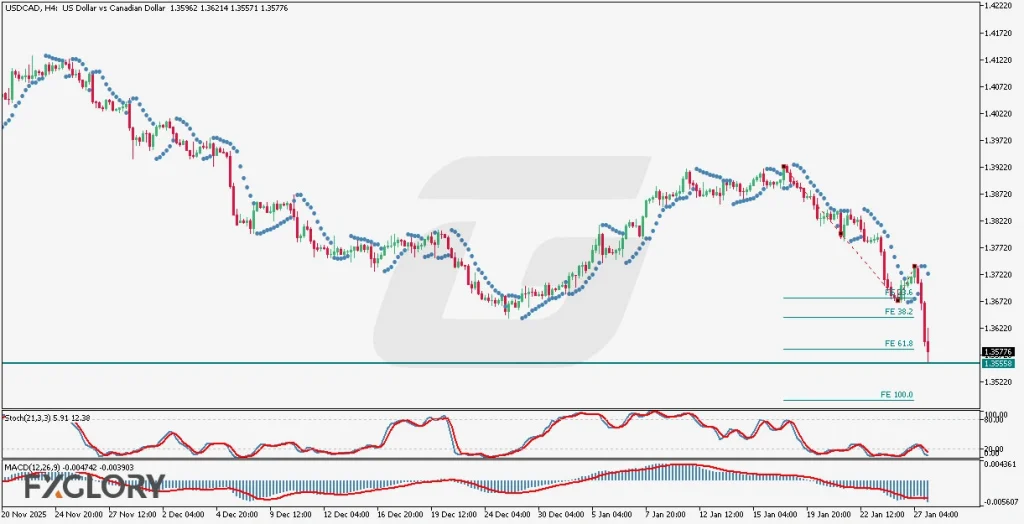
USDCAD analysis in the H4 timeframe exhibits clear bearish momentum. Despite a temporary change in the trend, the chart has been showing signs of bearish momentum, which recently gained significant strength, reaching a historical support level at 1.35558, a level the chart previously struggled to breach. Currently, price action indicates accelerated downward movement, with candles demonstrating increasingly forceful declines following brief bullish corrections. According to the Fibonacci expansion levels, candles have already surpassed the 61.8 level, indicating potential continuation to lower levels, particularly targeting the Fibonacci expansion 100.0 level if support is decisively broken.
Key Technical Indicators:
Parabolic SAR: The dots are placed above the candles, reinforcing the current bearish sentiment. This suggests a continued bearish trajectory, indicating selling pressures are prevalent and traders should remain cautious about bullish reversals.
Stochastic (21,3,3): Currently at 5.91 and 12.38, the Stochastic indicator reflects a highly oversold condition. However, this oversold status doesn’t immediately imply a reversal; instead, it might indicate continued bearish pressure unless a bullish crossover occurs.
MACD (12,26,9): With values of -0.004742 and -0.003903, the MACD indicator signifies bearish momentum as it remains negative with expanding histograms. This condition suggests increasing bearish momentum and ongoing selling pressure.
Support and Resistance:
Support: Immediate and critical support is at 1.35558, representing historical lows and a significant barrier for continued downward momentum.
Resistance: Immediate resistance stands near the Fibonacci expansion level at 1.3620, which was previously a key psychological area and prior short-term consolidation zone.
Conclusion and Consideration:
The USDCAD pair on the H4 chart indicates strong bearish momentum, supported by the Parabolic SAR, MACD, and oversold conditions in the Stochastic indicators. The bearish sentiment is validated by robust price action that recently broke significant Fibonacci levels, confirming the downward trajectory. Traders should remain vigilant around the critical support at 1.35558, as a decisive break below could open further declines towards the Fibonacci expansion 100.0 level.
Disclaimer: The analysis provided for USD/CAD is for informational purposes only and does not constitute investment advice. Traders are encouraged to perform their own analysis and research before making any trading decisions on USDCAD. Market conditions can change quickly, so staying informed with the latest data is essential.