Time Zone: GMT +2
Time Frame: 4 Hours (H4)
Fundamental Analysis:
The USDJPY currency pair is currently navigating a high-volatility environment driven by diverging fiscal and monetary pressures. While the EURUSD H4 trend often sets the broader market tone, the Japanese Yen has recently surged due to suspected intervention by the Ministry of Finance and a hawkish shift in the Bank of Japan’s (BOJ) inflation outlook. Conversely, the US Dollar faces significant “data fog” and bearish pressure following a prolonged government shutdown, which has delayed critical reports such as Durable Goods Orders. As traders monitor the price action for EURUSD as a barometer for dollar strength, the USD-JPY pair remains sensitive to Corporate Services Price Index (CSPI) data and potential BOJ rate hike signals, making the 155.000–159.000 range a battlefield for central bank policy and safe-haven flows.
Price Action:
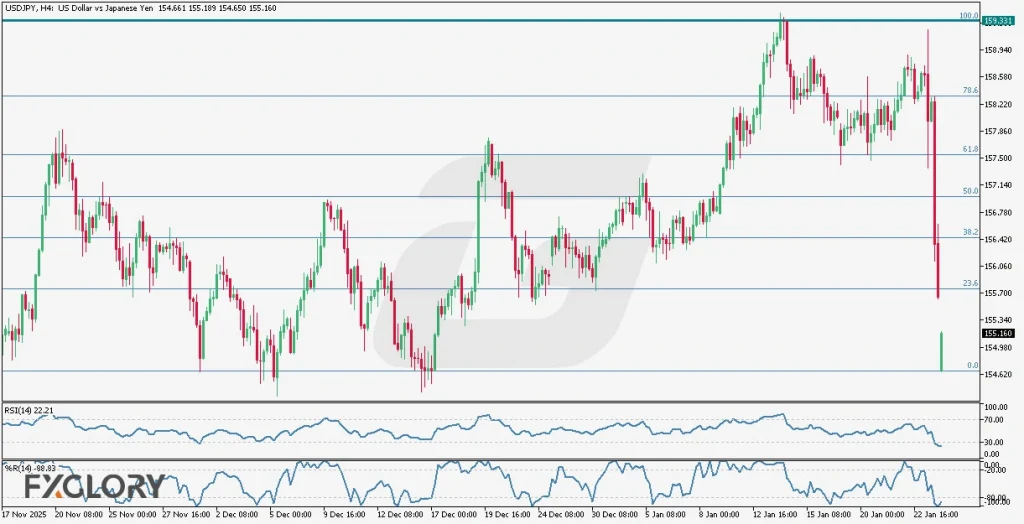
The USDJPY chart on the H4 timeframe reveals a significant shift in market structure; the pair had been moving along a robust bullish trend until it reached the strong resistance level at 159.331, a zone with verified historical significance. The candles attempted to retest that ceiling, but this second attempt resulted in a sharp bearish rejection, creating a double top sentiment. Currently, the market has opened with a downward gap, suggesting that the initial bullish momentum has stalled. We can expect to see a corrective phase from this level; based on the Fibonacci retracement levels, the 23.6% or even the 38.2% level could serve as a primary target for the end of this correction before any potential trend resumption.
Key Technical Indicators:
RSI (14): The Relative Strength Index is currently positioned at 22.21, placing it deep within the oversold territory. This extreme reading confirms the intensity of the recent sharp bearish move from the 159.331 resistance. While it suggests the downward momentum is strong, it also alerts traders to a potential “snap-back” or technical bounce as the selling pressure becomes overextended.
William’s %R (14): Reflecting the RSI’s sentiment, the William’s %R sits at -88.83, indicating an oversold market condition. This indicator highlights that the price is currently trading near the bottom of its recent range. A move back above -80 would be the first sign that the corrective bearish wave is losing steam and a local bottom is forming.
Support and Resistance:
Support: Immediate support is identified at the 154.450 area, aligning with recent swing lows and the psychological 154.500 level.
Resistance: The primary resistance stands firm at 159.331, which acted as a major ceiling and the catalyst for the current bearish reversal.
Conclusion and Consideration:
The USDJPY H4 chart forecast indicates a period of cooling after an aggressive bullish run. The failure to breach 159.331 combined with oversold RSI and William’s %R readings suggests that while the immediate trend is bearish, a corrective bounce or consolidation is likely as the market “fills the gap.” For a comprehensive EURUSD daily technical analysis, traders should note how USD weakness affects the entire FX board, especially with the US government shutdown distorting the Durable Goods data. High-impact news from the BOJ regarding the Corporate Services Price Index (CSPI) remains the wild card for JPY volatility today.
Disclaimer: The analysis provided for USD/JPY is for informational purposes only and does not constitute investment advice. Traders are encouraged to perform their own analysis and research before making any trading decisions on USDJPY. Market conditions can change quickly, so staying informed with the latest data is essential.