Time Zone: GMT +2
Time Frame: 4 Hours (H4)
Fundamental Analysis:
The XAU/USD pair continues to respond to the dynamics of the US Dollar, influenced by upcoming economic events and key speeches. Today, traders will closely monitor remarks from Federal Reserve Bank of Richmond President Thomas Barkin during a fireside chat at the North Carolina Bankers Association Economic Forecast Forum. Historically, hawkish statements support a stronger USD, potentially adding volatility to gold prices. Additionally, bond market dynamics from recent treasury auctions will reflect investor sentiment toward future interest rates and may indirectly impact gold prices.
Price Action:
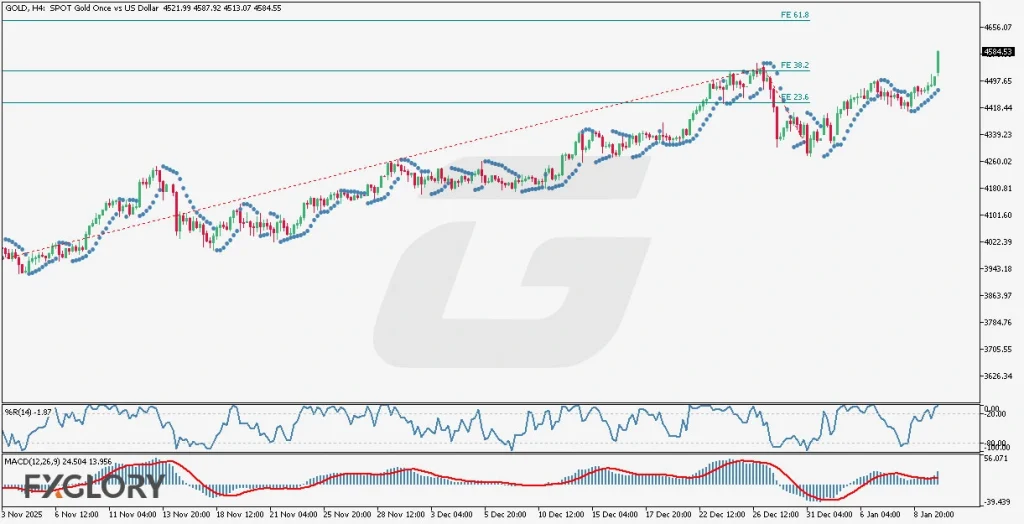
Gold’s recent price action on the H4 chart demonstrates a predominantly bullish trajectory, characterized by sharp corrections and equally decisive recoveries. After a recent substantial bearish pullback, gold has rebounded notably, surpassing the Fibonacci expansion level at 38.2. Current bullish momentum suggests that the next target could be the Fibonacci 61.8 level. The gradual uptrend remains evident despite periodic volatility.
Key Technical Indicators:
Parabolic SAR: Parabolic SAR dots positioned below the candlesticks suggest ongoing bullish momentum, providing strong support for the current uptrend in XAU/USD.
William’s %R (14): Currently at -1.87, William’s %R indicates strong bullish momentum, with the market nearing overbought conditions. Traders should watch for potential pullbacks or short-term consolidation.
MACD (12,26,9): The MACD histogram at 24.504 with a signal line at 13.956 shows strong upward momentum, reinforcing bullish sentiment. However, any narrowing of the histogram should be monitored for signs of weakening bullish momentum.
Support and Resistance:
Support: Immediate support for gold lies near the Fibonacci expansion level 38.2 around 4500.00, coinciding with recent price consolidations.
Resistance: The next key resistance level is identified at Fibonacci expansion 61.8 near 4565.00, marking a critical bullish target.
Conclusion and Consideration:
The technical and fundamental analysis for gold on the H4 chart suggests a sustained bullish outlook, supported strongly by indicators such as Parabolic SAR, William’s %R, and MACD. Nevertheless, traders should remain vigilant due to potential volatility arising from today’s Fed speech and bond market movements. Keeping track of upcoming events and key levels, particularly the resistance at 4565.00, will be crucial for informed trading decisions.
Disclaimer: The analysis provided for XAU/USD is for informational purposes only and does not constitute investment advice. Traders are encouraged to perform their own analysis and research before making any trading decisions on XAUUSD. Market conditions can change quickly, so staying informed with the latest data is essential.