Time Zone: GMT +2
Time Frame: 4 Hours (H4)
Fundamental Analysis:
Today, USD and CHF face significant market-moving events. The USD will react to employment-related reports, including Job Cut Announcements, Initial Jobless Claims, and productivity and labor cost statistics. Lower-than-forecast jobless claims and higher productivity readings typically strengthen the dollar. CHF traders will closely observe the release of the Consumer Price Index (CPI), which significantly influences the Swiss Franc valuation due to inflation implications. Additionally, insights from the Swiss National Bank (SNB) meetings might trigger increased volatility, making it vital to follow these events for informed trading decisions.
Price Action:
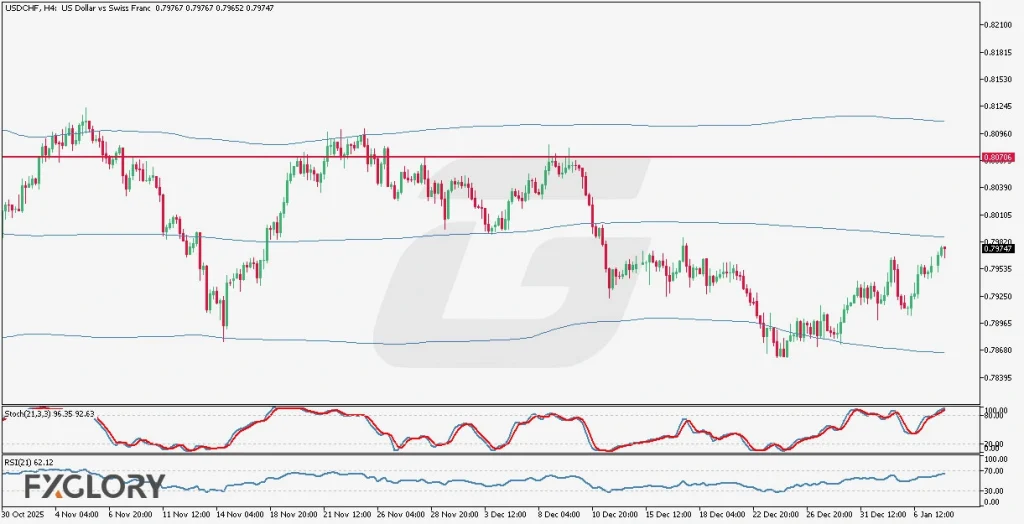
Analyzing USDCHF on the H4 timeframe reveals the pair trading within a defined range, consistently reacting when hitting the Bollinger Bands (350). Currently, bullish price action is evident, characterized by swift upward movements interspersed with minor corrections. Considering past market reactions, an upward trajectory toward the resistance at 0.80706 is anticipated, aligning with historical highs and previous reversal points.
Key Technical Indicators:
Bollinger Bands (350): The Bollinger Bands are currently narrowing, signifying potential decreased volatility before a decisive breakout. Price candles are approaching the mid-band, suggesting possible continuation upward toward the upper band.
Stochastic (21,3,3): With current readings at 96.35 and 92.63, the Stochastic Oscillator indicates USDCHF is significantly overbought. Traders should be cautious as these levels could forecast a potential corrective pullback.
RSI (21): The RSI currently stands at 62.12, signaling strength in the bullish momentum. Although it has room to reach higher values before reaching overbought territory (70), traders should remain vigilant about potential reversals.
Support and Resistance:
Support: Immediate support aligns with recent market activity around 0.79300, near the lower Bollinger Band, providing a significant level of interest.
Resistance: Key resistance stands firmly at 0.80706, marking a previous high level where historical reversals occurred.
Conclusion and Consideration:
USDCHF’s H4 chart analysis suggests a continuation of bullish momentum toward resistance at 0.80706, supported by Bollinger Bands, RSI, and current price action. Nevertheless, the significantly overbought Stochastic oscillator indicates possible short-term pullbacks. Fundamental events today, particularly USD employment data and CHF CPI release, could introduce volatility and should be monitored closely.
Disclaimer: The analysis provided for USD/CHF is for informational purposes only and does not constitute investment advice. Traders are encouraged to perform their own analysis and research before making any trading decisions on USDCHF. Market conditions can change quickly, so staying informed with the latest data is essential.