Time Zone: GMT +2
Time Frame: 4 Hours (H4)
Fundamental Analysis:
The AUD/USD currency pair is currently influenced by anticipated economic reports from Australia, including the Consumer Price Index (CPI) and Building Approvals data. CPI figures significantly impact the AUD since inflation directly affects monetary policy decisions by the Reserve Bank of Australia (RBA). Positive CPI results, indicating rising inflation, typically strengthen the Australian dollar due to expectations of higher interest rates. Meanwhile, upcoming USD data releases, such as employment figures, ISM Non-Manufacturing PMI, and crude oil inventories, will influence USD strength. Traders should monitor these data points closely, as better-than-forecast results would provide robust support for the US dollar.
Price Action:
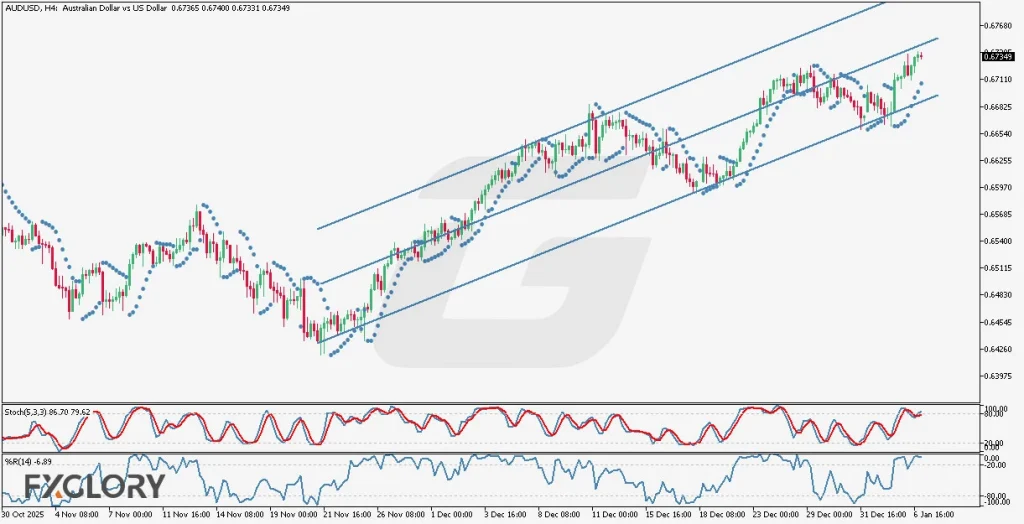
The AUDUSD pair’s price action analysis on the H4 chart reveals a clear upward trajectory within an ascending channel with a notable sharp steepness. Currently, the price resides in the middle area of the channel, indicating potential indecision or temporary consolidation. A continued upward movement would require breaking above this midpoint decisively, whereas bearish pressure might see prices retreat towards the immediate support level at the channel’s lower trend line.
Key Technical Indicators:
Parabolic SAR: The dots are plotted below the candles, clearly signaling ongoing bullish momentum and support for the current upward trend. Traders should watch for any reversal of the dots above the candles, which would indicate a bearish shift.
Stochastic (5,3,3): The indicator shows readings at 86.70 and 79.62, placing the AUDUSD in the overbought territory. This indicates potential upcoming bearish corrections, though prices may still remain bullish for a brief period. Traders must remain cautious and watch for stochastic crossover signals.
Williams %R (14): At a current reading of -6.89, Williams %R is also deeply in overbought conditions, suggesting imminent short-term reversal potential. Traders should prepare for possible pullbacks or consolidation at current price levels.
Support and Resistance:
Support: Immediate support is established at the lower trend line of the ascending channel around the 0.6670 area, serving as a strong barrier against bearish pressures.
Resistance: Key resistance level is currently situated at the upper trend line of the channel near the 0.6768 mark, representing the primary target for bullish continuation.
Conclusion and Consideration:
The AUDUSD H4 chart presents bullish momentum within an ascending channel, supported by Parabolic SAR indicators. However, overbought conditions noted by Stochastic and Williams %R indicators suggest caution, as a potential bearish correction or consolidation could occur. Fundamental data releases related to AUD and USD are critical factors to watch, as strong outcomes could influence immediate price direction significantly.
Disclaimer: The analysis provided for AUD/USD is for informational purposes only and does not constitute investment advice. Traders are encouraged to perform their own analysis and research before making any trading decisions on AUDUSD. Market conditions can change quickly, so staying informed with the latest data is essential.