Time Zone: GMT +2
Time Frame: 4 Hours (H4)
Fundamental Analysis:
The EUR/GBP currency pair is currently navigating a low-liquidity environment due to today’s Epiphany Day bank holiday in Italy, leading to irregular volatility across the Euro markets. Although most forex brokers remain open, bank closures reduce overall transaction volumes, making the market more susceptible to speculative price swings. Moreover, no high-impact GBP data is scheduled today, with the most relevant upcoming release being the UK Services PMI on February 4, 2026. For the Eurozone, traders will closely monitor upcoming Consumer Price Index (CPI) releases from Germany and France later this month, which are crucial indicators of inflation and will influence future ECB monetary policy. In the absence of major economic data today, technical signals may take precedence in guiding short-term price movements for EUR-GBP H4 analysis.
Price Action:
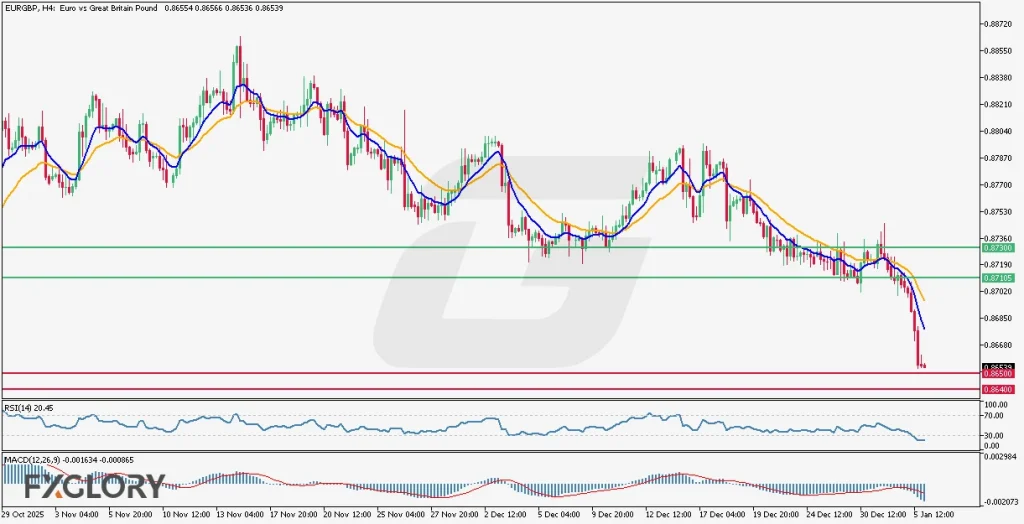
EURGBP has shown strong bearish momentum over recent H4 candles, with a notable drop from around 0.87400 to the current level of 0.86539. The pair has consistently printed bearish candles, forming a steep downward channel. Price has broken below key psychological and technical support levels and currently consolidates near the lows. This sharp decline and clean break of structure indicate dominant seller control, reinforcing bearish sentiment in this H4 timeframe analysis.
Key Technical Indicators:
Moving Averages (MA 9 and MA 21): The short-term 9-period moving average is trending below the longer-term 21-period moving average, both sloping downward. This crossover and alignment confirm a strong bearish trend on the EURGBP H4 chart. The moving averages have also acted as dynamic resistance during recent pullbacks, supporting ongoing downward pressure.
RSI (Relative Strength Index 14): The RSI is currently at 20.45, which places it in the oversold territory. This level suggests extreme bearish conditions and could signal an upcoming price correction or temporary consolidation. However, in strong trends, the RSI can remain oversold for extended periods.
MACD (12, 26, 9): The MACD line is positioned well below the signal line, with both lines in negative territory. The histogram shows increasing bearish momentum, confirming the strength of the downtrend. No divergence is present, indicating there are no early signs of a reversal at this stage.
Support and Resistance:
Support: The nearest support level is observed around 0.86500, followed by a more critical level at 0.86400, where price may attempt to stabilize or bounce.
Resistance: Immediate resistance lies near 0.87100, and a stronger resistance level can be seen around 0.87300, aligning with recent consolidation zones and the moving average area.
Conclusion and Consideration:
In conclusion, the EURGBP pair on the H4 chart exhibits a firm bearish trend, as validated by price action, moving averages, MACD, and RSI indicators. Although RSI is in oversold territory, there are no clear reversal signals yet. Traders should watch for potential price consolidation or corrective pullbacks toward resistance zones, particularly if volatility decreases due to low liquidity. However, any sustained break below 0.86400 may invite further selling pressure. In the context of daily H4 technical and fundamental chart analysis, EUR GBP is likely to remain bearish unless significant bullish catalysts emerge.
Disclaimer: The analysis provided for EUR/GBP is for informational purposes only and does not constitute investment advice. Traders are encouraged to perform their own analysis and research before making any trading decisions on EURGBP. Market conditions can change quickly, so staying informed with the latest data is essential.