Time Zone: GMT +2
Time Frame: 4 Hours (H4)
Fundamental Analysis:
Today’s economic calendar for the USDJPY pair highlights the upcoming Manufacturing PMI reports from both Japan (Jibun Bank Manufacturing PMI) and the US (ISM Manufacturing PMI and Manufacturing Prices Paid). These indicators are vital, as a reading above 50.0 suggests industry expansion and could positively impact their respective currencies. Traders will closely monitor the PMI data, as better-than-forecasted numbers typically strengthen the currency, potentially influencing USDJPY volatility.
Price Action:
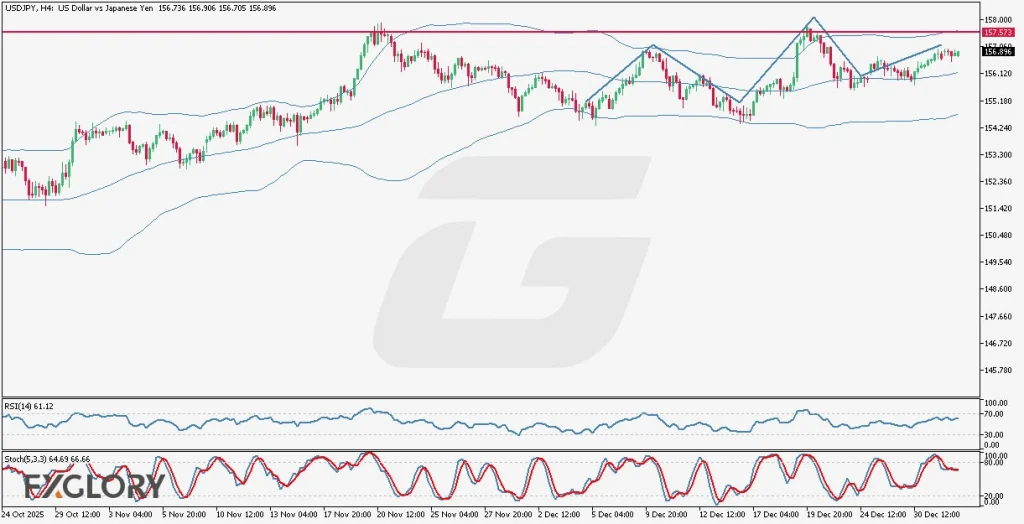
Analyzing the USDJPY H4 chart, the pair has recently moved in a bullish trajectory until reaching a strong resistance at 157.573. After this, the pair entered into consolidation, struggling to break through this significant resistance level. Price has since retraced slightly downward, forming a classical bearish head and shoulders pattern, indicating a potential reversal. Given the current momentum, it is unlikely for the pair to significantly breach the established resistance if another bullish move is attempted.
Key Technical Indicators:
RSI (14): Currently at 61.12, the RSI indicates moderately bullish momentum. Although still below the overbought threshold (70), the RSI’s position implies there is limited upside potential, supporting the bearish reversal indicated by the price action.
Stochastic (5,3,3): The stochastic oscillator is currently at 64.69 and 66.66, reflecting moderate bullish sentiment but indicating possible weakening of buying pressure. The indicator’s current positioning suggests that the market could be preparing for a bearish correction, aligning with the emerging head and shoulders pattern.
Bollinger Bands (70): The bands are closely positioned (156.736 lower, 156.906 middle, and 156.896 upper), signaling decreased volatility and indicating potential consolidation. Given the narrow range of the bands, traders should prepare for a breakout or notable movement soon, most likely to the downside due to current price patterns.
Support and Resistance:
Support: Immediate support is seen near the lower Bollinger Band at 156.736, with a stronger support level around the recent consolidation area at 156.300.
Resistance: The key resistance remains at the significant 157.573 level, the recent high and the main barrier to further bullish progression.
Conclusion and Consideration:
The current USDJPY H4 chart indicates that a bearish reversal may be imminent, supported by the head and shoulders formation and weakening momentum indicators (RSI and Stochastic). Traders should remain cautious of the potential volatility following today’s PMI releases from both Japan and the US. This could significantly influence short-term trading conditions. Investors should closely monitor these developments, maintaining tight stop-losses around established resistance and support levels.
Disclaimer: The analysis provided for USD/JPY is for informational purposes only and does not constitute investment advice. Traders are encouraged to perform their own analysis and research before making any trading decisions on USDJPY. Market conditions can change quickly, so staying informed with the latest data is essential.