Time Zone: GMT +2
Time Frame: 4 Hours (H4)
Fundamental Analysis:
Today, GBP/USD traders are closely watching a packed schedule of UK economic data releases, including GDP, Construction Output, Visible Trade Balance, GVA, and Manufacturing & Industrial Production—all from the Office for National Statistics. Positive surprises across these metrics would likely strengthen the British Pound, as they reflect improvements in economic health and productivity. On the other side, several FOMC speakers from the U.S. are scheduled to speak today, which could introduce intraday volatility depending on the tone of their comments regarding monetary policy outlook. If hawkish, the USD may gain strength, putting pressure on GBP/USD.
Price Action:
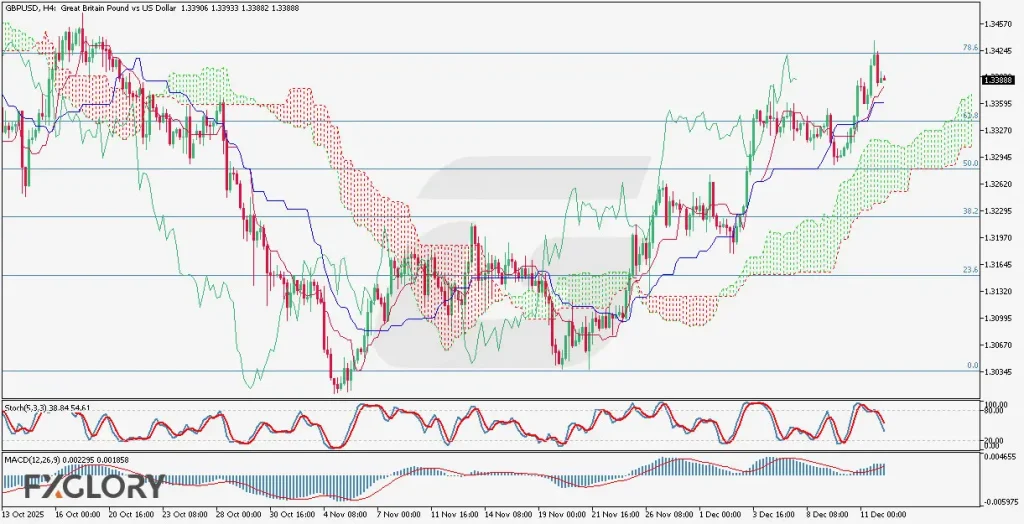
The GBP/USD H4 chart shows the pair in a recent bullish trend, having recovered strongly from a previous downward move. After a rally that breached the 50.0% and 61.8% Fibonacci retracement levels, the price touched the 0.786 Fibonacci level, forming a strong bearish candle. This was followed by a small bullish candle, which was not sufficient to counter the previous bearish momentum. Despite this, price action remains above the Ichimoku cloud, indicating bullish control, although caution is warranted due to recent signs of weakness. The price is currently ranging around 1.3388, and whether it sustains above this area will determine the next leg.
Key Technical Indicators:
Ichimoku Cloud: The price is trading above the cloud, which is generally a bullish signal. The leading span A (upper band) is sloping upward, confirming bullish momentum, while span B (lower band) remains flat, suggesting some consolidation risk. This mix hints at a possible short-term pause in the uptrend unless supported by strong fundamentals.
MACD (12,26,9): The MACD line is at 0.002295, slightly above the signal line at 0.001858, indicating continued but moderating bullish momentum. The histogram bars are narrowing, suggesting a possible early sign of a weakening trend or consolidation phase.
Stochastic Oscillator (5,3,3): The Stochastic values are at 38.84 and 54.61, indicating that the pair has pulled back from overbought conditions. This positioning allows for renewed bullish entries, but a break below 20 would be a bearish signal. Traders should monitor a potential crossover to the upside as a bullish continuation sign.
Support and Resistance:
Support: The first key support lies around the 1.3320 area, aligned with the upper edge of the Ichimoku cloud and the 61.8% Fibonacci level. A break below this level could open the door to 1.3260 (50% Fibo retracement).
Resistance: Immediate resistance is found near 1.3445, which corresponds to the recent high and the 78.6% Fibonacci retracement. A clean break above this level could lead to testing the psychological level of 1.3500.
Conclusion and Consideration:
The GBP USD H4 analysis indicates that while the pair remains in a bullish structure, recent price action near the 0.786 Fibonacci level shows hesitation, likely due to upcoming high-impact news. Technical indicators are showing early signs of potential consolidation, and traders should remain cautious ahead of the GDP and trade data from the UK, along with multiple U.S. Fed speeches. If UK data surprises to the upside, it could reinforce the bullish trend; however, dovish UK data or hawkish U.S. commentary may push GBP-USD lower. Active traders should closely watch key levels and be ready to adjust their strategies based on price action and macro developments.
Disclaimer: The analysis provided for GBP/USD is for informational purposes only and does not constitute investment advice. Traders are encouraged to perform their own analysis and research before making any trading decisions on GBPUSD. Market conditions can change quickly, so staying informed with the latest data is essential.