Time Zone: GMT +2
Time Frame: 4 Hours (H4)
Fundamental Analysis:
Today, EURUSD traders will closely monitor upcoming economic indicators from the US and Eurozone. In the US, traders await key reports from Automatic Data Processing (ADP), Bureau of Labor Statistics, and the Federal Reserve regarding employment change, import prices, capacity utilization, industrial production, and PMI data. Positive outcomes in these indicators typically strengthen the USD. Meanwhile, in the Eurozone, market participants are anticipating the Purchasing Managers’ Index (PMI) data and a crucial testimony from ECB President Christine Lagarde, whose remarks could significantly impact EURUSD volatility.
Price Action:
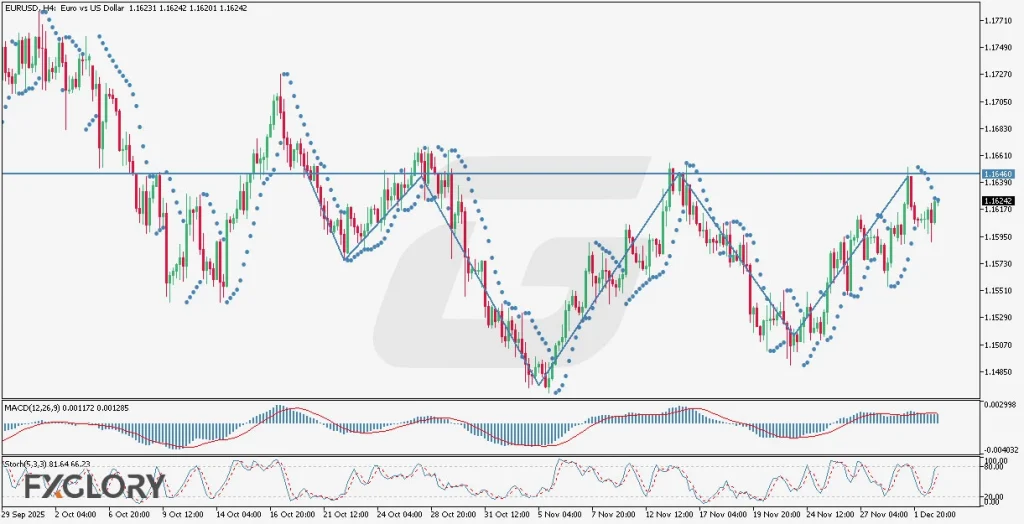
Analyzing EURUSD price action on the H4 chart reveals an overall bullish trend over the longer period. Recently, candles have adopted a bearish trajectory but have formed a bullish inverted head and shoulders pattern. Given this bullish pattern and current momentum, traders can reasonably expect bullish price action continuation towards the key resistance around the 1.18151 level, historically responsive to price action.
Key Technical Indicators:
Parabolic SAR: Currently, Parabolic SAR dots are positioned above the EURUSD candles, very close to price action, suggesting that a potential bullish reversal may occur soon if dots shift beneath the candles, reaffirming upward momentum.
MACD (12, 26, 9): The MACD indicator shows a current reading of 0.001172 and 0.001285, with the MACD line slightly below the signal line but narrowing. This signals decreasing bearish momentum and a potential bullish crossover soon, aligning with anticipated upward price action.
Stochastic (5, 3, 3): The Stochastic oscillator indicates overbought conditions at 81.64 and 66.23, suggesting short-term bullish strength. However, given these elevated levels, traders should also consider the possibility of a brief corrective pullback before the bullish trend resumes.
Support and Resistance:
Support: Immediate support is visible at around 1.15500, a recent consolidation zone and neckline of the inverted head and shoulders pattern.
Resistance: Key resistance is situated at approximately 1.16460, previously tested and historically relevant for price reactions.
Conclusion and Consideration:
Overall, EURUSD technical analysis for the H4 timeframe shows strong bullish potential supported by technical indicators and price action formations. However, the imminent release of significant US and Eurozone economic data could introduce volatility. Traders should closely monitor the Parabolic SAR for confirmation of bullish momentum and consider temporary pullbacks indicated by the Stochastic oscillator.
Disclaimer: The analysis provided for EUR/USD is for informational purposes only and does not constitute investment advice. Traders are encouraged to perform their own analysis and research before making any trading decisions on EURUSD. Market conditions can change quickly, so staying informed with the latest data is essential.