Time Zone: GMT +2
Time Frame: 4 Hours (H4)
Fundamental Analysis:
The NZD/USD pair is currently influenced by fundamental market indicators. The upcoming Retail Sales data from Statistics New Zealand, which measures changes in inflation-adjusted sales, could significantly impact the NZD. Positive results typically strengthen the New Zealand dollar, reflecting robust consumer spending. Furthermore, the monthly ANZ Business Confidence survey, indicating economic sentiment across key sectors, could also drive short-term volatility. Meanwhile, the USD faces expected low liquidity due to the Thanksgiving Bank Holiday, potentially leading to irregular and unpredictable volatility within the Forex market.
Price Action:
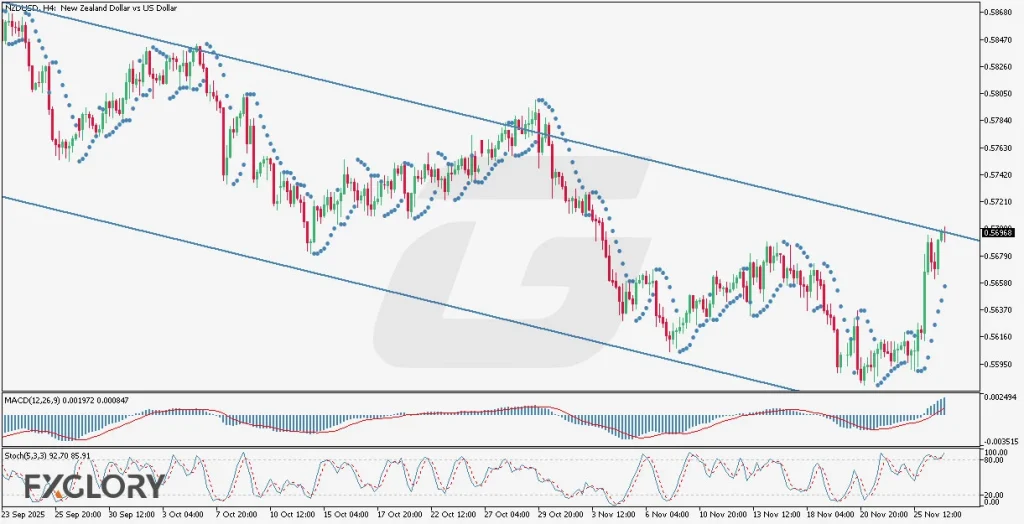
Analyzing the NZDUSD pair on the H4 timeframe, the currency pair remains in a clear bearish trend, characterized by a descending channel. Price action shows consistent bounces within this bearish channel, validating the trend’s reliability. The most recent candles have approached the upper boundary, suggesting potential overbought conditions and a likely reversal to the downside, aligning with the overall bearish sentiment.
Key Technical Indicators:
Parabolic SAR: Currently, the dots are positioned below the candles, traditionally indicating bullish sentiment. However, given the proximity to the upper channel boundary and the overall bearish trend, caution for a reversal to bearish momentum is warranted.
MACD (12, 26, 9): The MACD indicator shows values of 0.001972 and a signal line at 0.000847, indicating bullish momentum. However, the relatively modest gap between MACD and its signal line suggests weakening bullish momentum, which aligns with expectations of a reversal at the channel’s resistance.
Stochastic (5, 3, 3): Stochastic readings are at 92.70 and 85.91, clearly within overbought territory. This indicates a high probability that the pair might face bearish pressure as traders anticipate a reversal from current resistance levels.
Support and Resistance:
Support: The immediate technical support level is around 0.5600, corresponding with recent swing lows.
Resistance: The nearest resistance lies at the channel’s upper boundary around 0.5700, coinciding with recent candle peaks.
Conclusion and Consideration:
The H4 chart for the NZDUSD pair suggests maintaining a bearish outlook despite short-term bullish indicators. With prices approaching significant resistance, traders should prepare for a potential bearish reversal, supported by overbought stochastic signals and decreasing MACD bullish momentum. Fundamental news concerning NZD could introduce volatility; thus, traders should closely monitor these releases and liquidity conditions due to the USD Thanksgiving Bank Holiday.
Disclaimer: The analysis provided for NZD/USD is for informational purposes only and does not constitute investment advice. Traders are encouraged to perform their own analysis and research before making any trading decisions on NZDUSD. Market conditions can change quickly, so staying informed with the latest data is essential.