Time Zone: GMT +2
Time Frame: 4 Hours (H4)
Fundamental Analysis:
The Silver price (XAG/USD) is currently influenced significantly by the USD’s economic indicators, particularly ahead of today’s crucial economic data releases. Market participants are closely monitoring upcoming reports such as Initial Jobless Claims, Durable Goods Orders, and the Chicago PMI. Positive numbers, meaning lower jobless claims and higher durable goods orders or Chicago PMI, could strengthen the USD, consequently applying downward pressure on Silver. Conversely, disappointing data could weaken the USD, providing upward support for Silver prices.
Price Action:
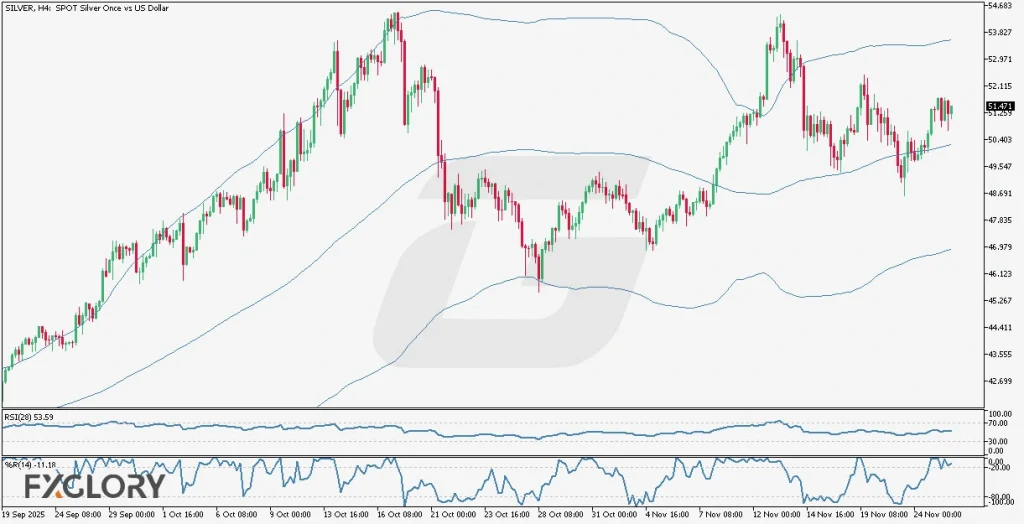
Analyzing Silver price action on the H4 chart reveals recent volatility following a strong bullish trend that subsequently encountered resistance, causing prices to retrace sharply. Currently, price movement indicates short-term bullish tendencies; however, recent candlesticks suggest potential consolidation or sideways movement as prices are struggling to surpass previous highs. Traders should be vigilant for any breakout signs from current consolidation ranges.
Key Technical Indicators:
Bollinger Bands (100): After a strong bullish run, candles frequently touched the outer Bollinger Bands, indicating high volatility. Currently, the narrowing bands suggest reduced volatility, though traders should watch for a potential breakout if bands widen again.
RSI (28): The RSI indicator is at 53.59, indicating neutral momentum. With the RSI hovering near the mid-level, the market is neither oversold nor overbought, suggesting a stable consolidation phase where prices might remain range-bound in the short term.
Williams’ %R (14): Currently at -11.18, the Williams’ %R signals near-overbought conditions. This suggests potential resistance at current price levels, cautioning traders to monitor for possible price pullbacks before continuation of any bullish momentum.
Support and Resistance:
Support: Immediate support is positioned near the psychological and recent consolidation area around 50.40, aligning with previous candlestick lows.
Resistance: The nearest resistance is observed around the recent high at approximately 52.10, where bullish attempts previously faltered.
Conclusion and Consideration:
The current Silver (XAG/USD) H4 analysis indicates a period of market consolidation following significant bullish momentum. Technical indicators, such as Bollinger Bands and RSI, suggest potential sideways movement in the near term, while Williams’ %R indicates possible resistance. Traders should remain alert for USD economic data today, which could trigger substantial volatility and directional moves for Silver.
Disclaimer: The analysis provided for XAG/USD is for informational purposes only and does not constitute investment advice. Traders are encouraged to perform their own analysis and research before making any trading decisions on XAGUSD. Market conditions can change quickly, so staying informed with the latest data is essential.