Time Zone: GMT +2
Time Frame: 4 Hours (H4)
Fundamental Analysis:
The Australian Dollar (AUD) is currently under moderate bearish pressure against the US Dollar (USD), with market participants closely watching macroeconomic developments and central bank commentary. On the USD side, today’s economic calendar is packed with high-impact events, including multiple speeches from key Federal Reserve officials such as Governor Waller, Michael Barr, Thomas Barkin, and even US President Donald Trump. These speeches are expected to offer fresh clues about future monetary policy, inflation outlooks, and regulatory considerations—potentially increasing USD volatility. Meanwhile, no major Australian data is due today, leaving the AUD vulnerable to external pressures. Market sentiment remains cautious ahead of the Reserve Bank of Australia’s next meeting on December 23, with traders already speculating on potential tightening or dovish hold scenarios.
Price Action:
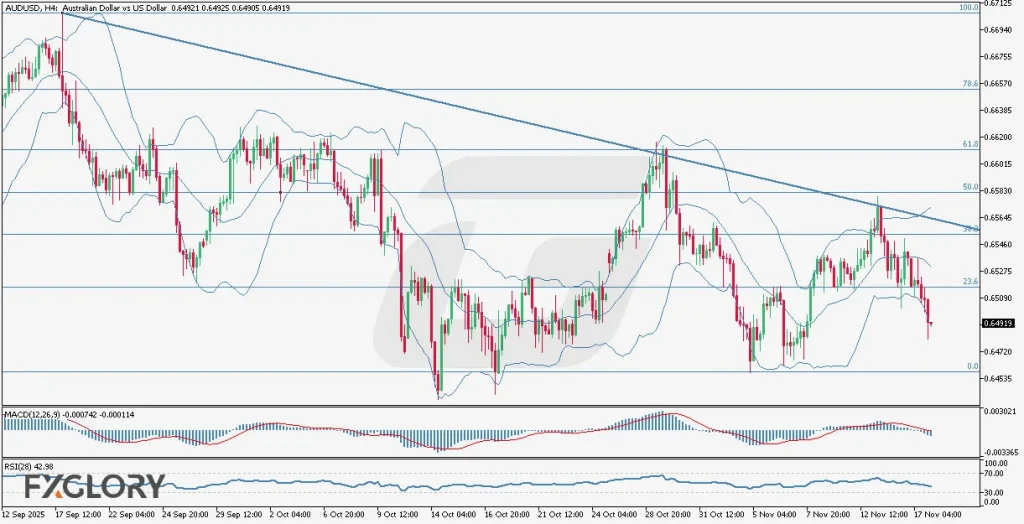
The AUDUSD H4 price action shows a clear bearish structure. The pair continues to respect a long-term descending trendline and recently failed to break above the 38.2% Fibonacci retracement level, instead reversing and falling below the 23.6% level. The latest candles are predominantly red and hugging the lower Bollinger Band, indicating consistent downward pressure. Recent price rejection at both the descending trendline and the 50-period EMA further confirms short-term bearish bias.
Key Technical Indicators:
Bollinger Bands: The Bollinger Bands are moderately wide, reflecting increased volatility in the AUD/USD H4 chart analysis. The price is currently hugging the lower band and closing below the 23.6% Fibonacci retracement level, suggesting strong bearish momentum. The continuous lower band interaction supports a trend continuation outlook.
MACD (12,26,9): The MACD line is at -0.000742 while the signal line reads -0.000114, with the histogram pushing further into negative territory. This widening divergence indicates increasing downside momentum. The MACD crossover below the zero line is a classic confirmation of the prevailing bearish trend in this technical and fundamental chart analysis.
RSI (28): The RSI is currently at 42.98, remaining below the neutral 50 level, reinforcing a bearish sentiment without entering oversold conditions. This RSI behavior suggests that the pair has room to move lower before any meaningful bullish correction emerges.
Support and Resistance:
Support: The first strong support lies around the 0.6450 level, which aligns with the recent swing low and the 0.0% Fibonacci retracement level, acting as the immediate bearish target.
Resistance: On the upside, key resistance is seen near 0.6560, which is both the 38.2% Fibonacci retracement level and the point of confluence with the descending trendline, making it a strong technical ceiling.
Conclusion and Consideration:
Based on the current H4 technical and fundamental analysis of AUD USD, the short- to medium-term bias remains bearish. With the price moving below key Fibonacci levels, respecting a downward trendline, and confirmed by MACD and RSI indicators, sellers appear to be in control. The upcoming USD news, particularly speeches from FOMC members and economic outlook discussions, could inject significant volatility into the pair. Given the lack of Australian data today, the USD side will likely dictate the pair’s next major move. Traders should monitor news headlines closely for any shifts in monetary policy tone from the Fed, which could influence AUD-USD volatility on the H4 time frame.
Disclaimer: The analysis provided for AUD/USD is for informational purposes only and does not constitute investment advice. Traders are encouraged to perform their own analysis and research before making any trading decisions on AUDUSD. Market conditions can change quickly, so staying informed with the latest data is essential.