Time Zone: GMT +2
Time Frame: 4 Hours (H4)
Fundamental Analysis:
The BTC/USD pair is influenced today by significant USD news, with Federal Reserve speakers Jeffrey Schmid and Lorie Logan set to discuss the economic outlook and monetary policy at the Joint Energy Conference. Hawkish statements typically strengthen the USD, potentially exerting downward pressure on BTC-USD. Additionally, natural gas inventory data could impact the USD volatility further, with lower-than-forecasted inventories usually benefiting USD strength.
Price Action:
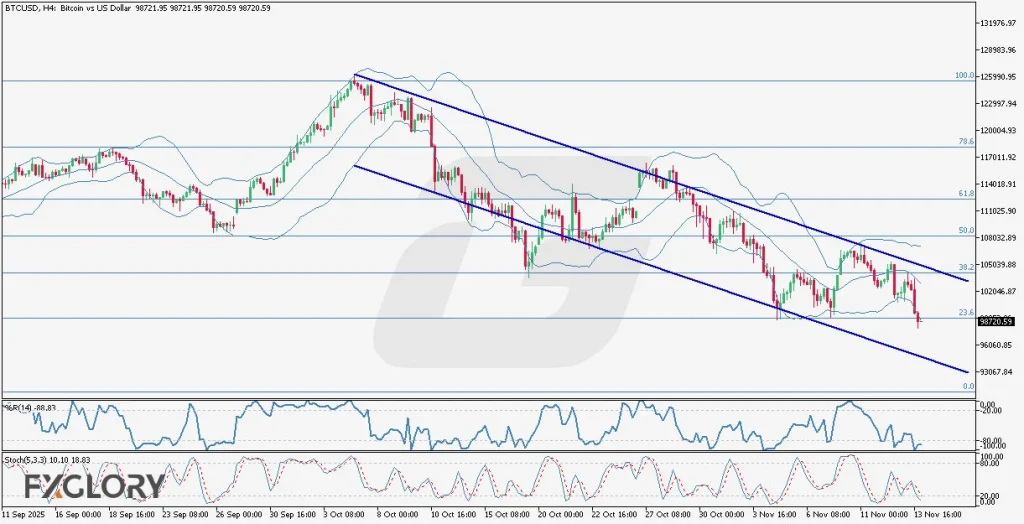
BTC/USD analysis on the H4 timeframe clearly shows a descending trend. Bitcoin recently broke below the significant psychological support at $100,000, marking its lowest price since May 2025. The current price has touched and is moving along the lower Bollinger Band, indicating strong bearish momentum. The last candle sits around the 23.6% Fibonacci retracement level, signaling potential for further bearish movement if this level is decisively broken, though oversold conditions suggest a possible correction soon.
Key Technical Indicators:
Bollinger Bands(20): The bands indicate increasing bearish volatility with BTC-USD consistently moving along the lower band. The middle and lower bands slope downward significantly, while the upper band remains relatively horizontal, emphasizing strong bearish dominance.
%R(14): Currently at -88.83, %R14 highlights a significantly oversold condition. Such low levels typically precede short-term bullish corrections, cautioning traders to watch for potential reversal signals.
Stochastic Oscillator (5,3,3): Presently at 10.10 and 18.83, the Stochastic indicates that BTC USD is deep in oversold territory. This signals an increased likelihood of a price correction or consolidation phase in the near term.
Support and Resistance:
Support: Immediate support is observed at the lower descending channel boundary near the $96,000 area, closely aligning with the 0 Fibonacci retracement level.
Resistance: The nearest resistance is at the former key support level of $100,000, coinciding with the 23.6% Fibonacci retracement.
Conclusion and Consideration:
The BTC/USD H4 chart demonstrates sustained bearish momentum, confirmed by key indicators such as Bollinger Bands, %R14, and Stochastic Oscillator. Although the trend remains bearish, the deeply oversold conditions suggest traders should be cautious about potential corrective rebounds. The USD news today could further exacerbate volatility, providing pivotal trading opportunities.
Disclaimer: The analysis provided for BTC/USD is for informational purposes only and does not constitute investment advice. Traders are encouraged to perform their own analysis and research before making any trading decisions on BTCUSD. Market conditions can change quickly, so staying informed with the latest data is essential