Time Zone: GMT +2
Time Frame: 4 Hours (H4)
Fundamental Analysis:
The GBP/USD currency pair continues to reflect ongoing market uncertainty as key economic events unfold today. For the USD, traders should closely monitor the Challenger Job Cut Announcements and the EIA Natural Gas Stocks data, as these reports can influence short-term volatility in the market. Additionally, speeches from prominent FOMC members, including Federal Reserve Governor Michael Barr and President John Williams, could inject significant volatility into USD trading, especially if their remarks imply potential shifts in monetary policy. On the GBP side, today’s release of the Construction PMI and the Bank of England’s Monetary Policy Report, along with Governor Andrew Bailey’s press conference, may significantly impact market sentiment and the GBP’s valuation.
Price Action:
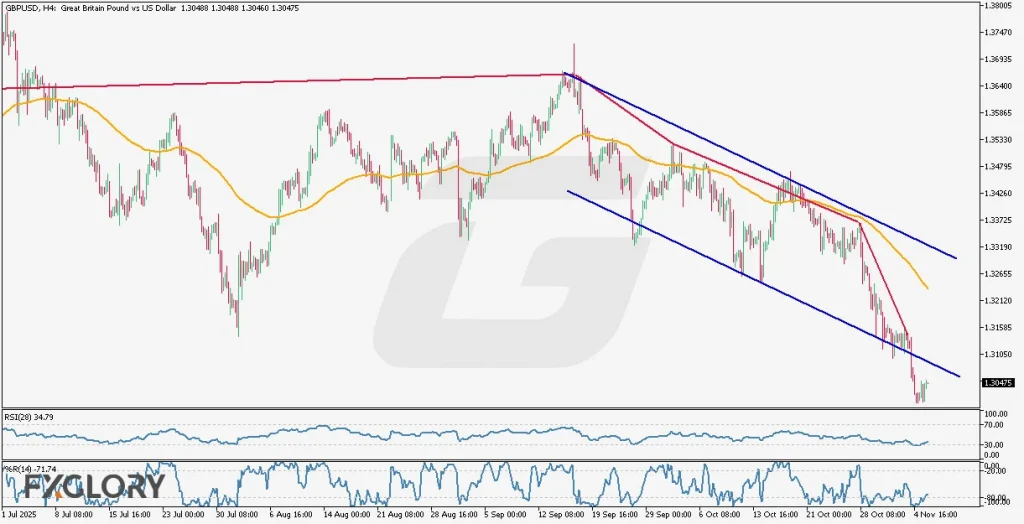
The GBP/USD H4 chart analysis highlights a distinct bearish channel, confirming strong downward momentum. Recently, price action has sharply breached the lower boundary of this bearish channel, indicating an aggressive selling pressure. While a brief corrective phase is expected given the oversold conditions, current price action strongly suggests bears are in control, forecasting a potential continuation of the bearish trend.
Key Technical Indicators:
Moving Average (100): Current candles are positioned significantly below the 100-period moving average, suggesting a strong bearish sentiment. However, the distance from the average is substantial, indicating that a corrective movement towards the moving average could occur in the short term.
RSI (28): The RSI stands at 34.79, reflecting oversold conditions and indicating potential exhaustion of the bearish momentum. Traders should remain alert for a possible bullish divergence or correction from current levels.
Williams %R: The Williams %R indicator is currently at -71.74, also denoting oversold conditions. This reinforces the possibility of a corrective rally but maintains the bearish sentiment overall as long as it remains below -50.
Support and Resistance:
Support: Immediate support is observed near the recent lows around 1.3020, a critical level for the bears to maintain momentum.
Resistance: Resistance is identified at 1.3150, coinciding with the lower boundary of the previously broken bearish channel, now serving as dynamic resistance.
Conclusion and Consideration:
The GBP/USD H4 technical analysis suggests continued bearish momentum, supported by price action and key technical indicators including the Moving Average, RSI, and Williams %R. However, oversold conditions on these indicators imply a potential short-term correction or consolidation phase. Traders must stay vigilant due to significant fundamental events today, notably the central bank communications from both the Federal Reserve and Bank of England, which could substantially alter current market dynamics.
Disclaimer: The analysis provided for GBP/USD is for informational purposes only and does not constitute investment advice. Traders are encouraged to perform their own analysis and research before making any trading decisions on GBPUSD. Market conditions can change quickly, so staying informed with the latest data is essential.