Time Zone: GMT +2
Time Frame: 4 Hours (H4)
Fundamental Analysis:
The EURUSD pair, representing the exchange rate between the Euro and the US Dollar, faces potential volatility today due to high-impact economic news. ECB President Christine Lagarde’s speech at the Bulgarian National Bank and Bundesbank President Joachim Nagel’s address in Berlin could induce significant movements in the euro, especially if their commentary hints at future monetary policy decisions. Meanwhile, the USD could react positively to Federal Reserve Governor Michelle Bowman’s insights on the Fed’s policy stance during the Santander International Banking Conference, as well as the RCM/TIPP Consumer Confidence data, shaping traders’ expectations for upcoming interest rate decisions and economic outlook.
Price Action:
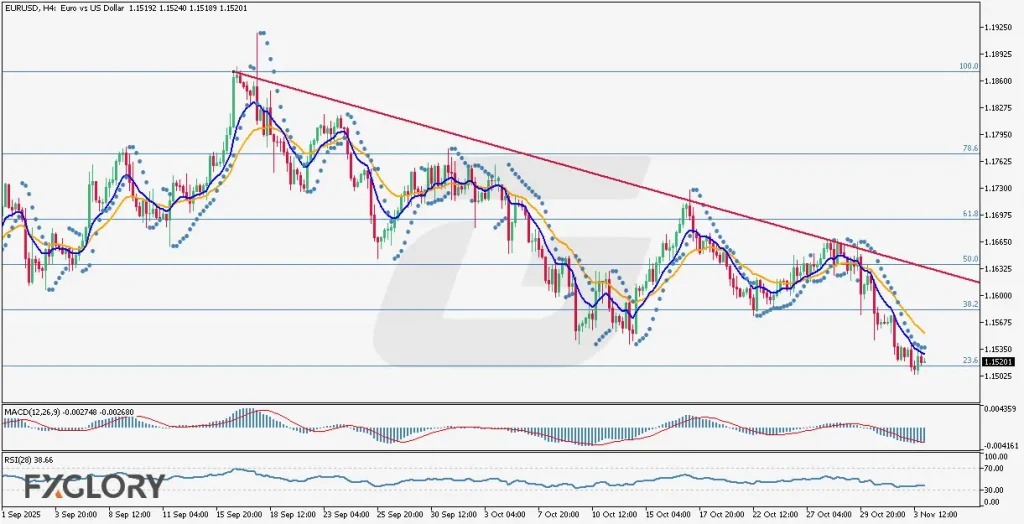
Analyzing EUR/USD price action on the H4 chart reveals a clear bearish trend, underpinned by a long-term descending red trend line. The price is struggling to surpass the 23.6% Fibonacci retracement level, indicating significant bearish pressure. Despite the current green candle suggesting minor bullish momentum, the overall market sentiment remains bearish, reinforced by sustained price action below major moving averages.
Key Technical Indicators:
Moving Averages (MA): The short-term blue 9 MA has crossed below the long-term orange 21 MA, clearly signaling bearish sentiment. Both averages are sloping downward, reinforcing the negative momentum in the pair, highlighting sellers’ dominance in the short-to-medium term.
Parabolic SAR: Currently positioned above the candles with parameters of 0.05/0.2, the Parabolic SAR dots confirm continued bearish momentum, providing strong technical validation for potential further downward movement.
MACD (Moving Average Convergence Divergence): The MACD histogram remains in negative territory, with both MACD and signal lines below the zero level, underscoring ongoing bearish momentum despite recent minor bullish fluctuations.
RSI (Relative Strength Index) 28: The RSI indicator at 38.66 reflects bearish market sentiment, though it’s not yet oversold, suggesting there remains additional downside potential before buyers may step in more decisively.
Support and Resistance:
Support: Immediate support appears firm near the current 23.6% Fibonacci retracement level, approximately at 1.1513, which has halted further bearish moves.
Resistance: Key resistance lies near the dynamic descending trendline, approximately around 1.1580, closely aligning with the 38.2% Fibonacci retracement level.
Conclusion and Consideration:
EUR-USD remains predominantly bearish on the H4 chart, supported by multiple technical indicators including moving averages, Parabolic SAR, MACD, and RSI. Traders should exercise caution and closely monitor the upcoming speeches from the ECB and Fed, as they hold the potential to significantly shift market dynamics and alter the current bearish trajectory. Due diligence and careful risk management are advised given today’s high-impact news environment.
Disclaimer: The analysis provided for EUR/USD is for informational purposes only and does not constitute investment advice. Traders are encouraged to perform their own analysis and research before making any trading decisions on EURUSD. Market conditions can change quickly, so staying informed with the latest data is essential.