Time Zone: GMT +2
Time Frame: 4 Hours (H4)
Fundamental Analysis:
The USD/CAD currency pair today is influenced primarily by a series of key U.S. Federal Reserve events, with several FOMC members including Lorie Logan, Raphael Bostic, and Beth Hammack scheduled to speak at the Evolving Landscape of Bank Funding Conference. Traders are closely monitoring their remarks for hints about future interest rate policy and potential shifts in the Fed’s stance toward inflation and economic growth. A more hawkish tone could strengthen the U.S. Dollar. Meanwhile, from the Canadian side, GDP data from Statistics Canada remains a key focus, with markets anticipating its next release later in November. Stronger-than-expected growth would support the Canadian Dollar, but today’s sentiment is likely to be dominated by U.S. policy commentary, keeping the USD/CAD exchange rate sensitive to Fed-related remarks and risk sentiment.
Price Action:
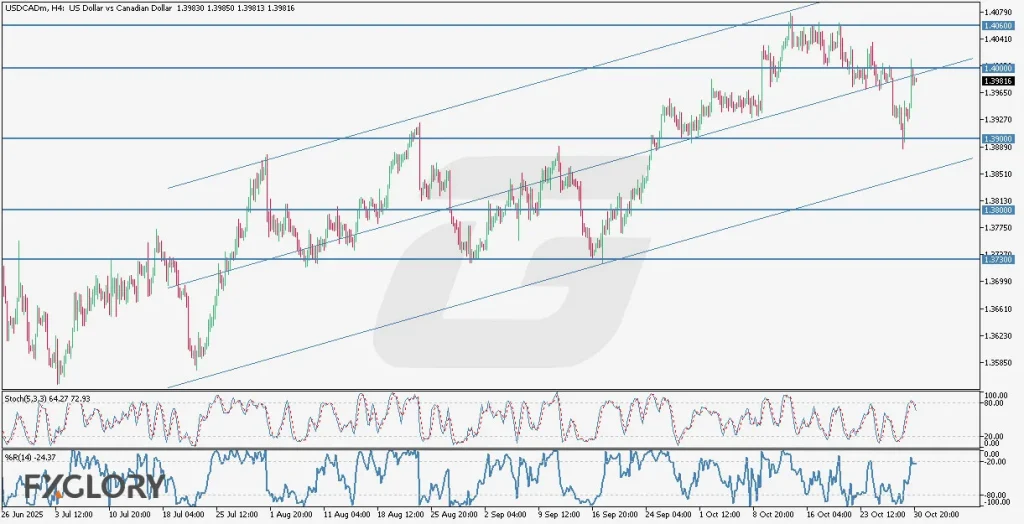
The USDCAD H4 chart shows that the pair continues to trade within a clear ascending channel, maintaining a bullish trend overall. Recently, the price bounced from the 1.39000 support level and rallied upward toward 1.40000, which acts as the first resistance near the regression channel’s midline. The market structure suggests steady bullish momentum, though short-term corrections are visible. A breakout above 1.40000 could pave the way toward 1.40600 resistance, while a failure to hold above the channel midpoint may lead to a retest of 1.39000 or deeper supports at 1.38000 and 1.37300.
Key Technical Indicators:
Stochastic (5,3,3): The Stochastic Oscillator is currently at 64.27 and 72.93, signaling that bullish momentum is still active but approaching overbought territory. This suggests possible short-term consolidation or mild retracement before the next upward move, especially if the pair fails to break the 1.40000 resistance cleanly.
Williams %R (14): The %R indicator stands at -24.37, which places it near the overbought zone. This reflects that buyers are in control but the pair may experience short-term exhaustion. If the indicator turns downward, a brief correction could follow, offering new entry opportunities near support levels within the channel.
Support and Resistance:
Support: The immediate support zone is around 1.39000, followed by deeper levels at 1.38000 and 1.37300, which historically have acted as strong demand areas.
Resistance: The nearest resistance is located at 1.40000, aligning with the channel’s midline. The next resistance stands at 1.40600, representing the upper boundary of the bullish channel and a potential breakout target.
Conclusion and Consideration:
The USDCAD H4 analysis indicates that the pair is trading in a bullish trend, supported by both price action and technical indicators. However, short-term caution is advised as the Stochastic and Williams %R approach overbought levels, which may lead to minor pullbacks before further gains. The overall bias remains bullish while the price stays above 1.39000.
Traders should monitor today’s U.S. Fed speeches and market sentiment closely, as any hawkish commentary could reinforce USD strength and support a breakout above 1.40000.
Disclaimer: The analysis provided for USD/CAD is for informational purposes only and does not constitute investment advice. Traders are encouraged to perform their own analysis and research before making any trading decisions on USDCAD. Market conditions can change quickly, so staying informed with the latest data is essential.