Time Zone: GMT +2
Time Frame: 4 Hours (H4)
Fundamental Analysis:
The AUD/USD pair is influenced today by significant economic data from both Australia and the United States. Australia’s CPI figures, essential for assessing inflationary pressures, could potentially strengthen the Australian Dollar if the actual figures surpass forecasts, implying stronger inflationary pressures and increased likelihood of interest rate hikes by the Reserve Bank of Australia. Conversely, the US Dollar faces potential volatility with data from pending home sales, crude oil inventories, and particularly from the FOMC’s statements and interest rate decisions. Traders will closely monitor these events for hints on future monetary policy shifts, significantly influencing the USD valuation.
Price Action:
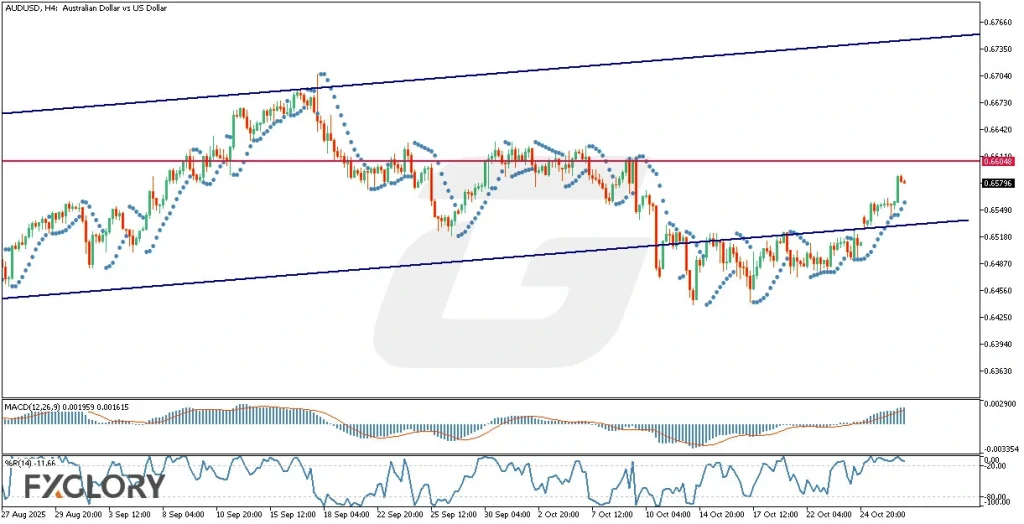
Analyzing the AUD/USD pair on the H4 timeframe, the candles have been progressing within a bullish channel over an extended period. Despite a recent unsuccessful breakout, the price action re-entered the bullish channel and resumed upward momentum following a correction phase. Currently, the sharp bullish momentum indicates minimal likelihood of an immediate bearish correction. Buyers are likely to maintain control until the pair reaches its previous high around the resistance level of 0.66048. If bearish pressure emerges, the trendline support of the bullish channel may serve as the subsequent downside target.
Key Technical Indicators:
Parabolic SAR: Currently, dots are positioned below the candles, clearly indicating a bullish trend continuation. The indicator suggests strong buying momentum persisting in the short-term scenario.
William’s %R: The indicator currently stands at -11.66, reflecting overbought conditions. However, in a robust bullish trend, such conditions might persist, implying continued strength and limited bearish retracement in the short term.
MACD: The MACD histogram is bullish, at 0.001959, with the signal line slightly below at 0.001615. This setup confirms ongoing bullish momentum, but traders should be vigilant for any narrowing which might suggest weakening momentum ahead.
Support and Resistance:
Support: Immediate support is identified at the bullish channel’s lower trendline around 0.65180, providing a robust barrier against bearish movements.
Resistance: Resistance is prominently placed at the previous high near the 0.66048 level, marking a critical threshold for bullish continuation.
Conclusion and Consideration:
The technical outlook for AUD/USD on the H4 chart indicates sustained bullish momentum, supported by clear bullish signals from Parabolic SAR, William’s %R, and MACD indicators. Traders should monitor closely for possible fluctuations from today’s pivotal economic announcements from Australia and the US, particularly the US FOMC statements and interest rate decisions, which could significantly impact market volatility and direction. Given the current bullish scenario, vigilance at critical resistance and support levels is recommended.
Disclaimer: The analysis provided for AUD/USD is for informational purposes only and does not constitute investment advice. Traders are encouraged to perform their own analysis and research before making any trading decisions on AUDUSD. Market conditions can change quickly, so staying informed with the latest data is essential.