Time Zone: GMT +2
Time Frame: 4 Hours (H4)
Fundamental Analysis:
The Gold USD pair, a primary safe-haven asset, faces significant short-term fundamental analysis pressure from evolving geopolitical and trade narratives today. The U.S. Dollar (USD) strength is highly susceptible to news regarding US-China trade negotiations, where Treasury Secretary Bessent’s optimistic remarks about China being ready for a trade deal could bolster market confidence and decrease demand for safe-haven assets like XAUUSD. Conversely, the threat of increased U.S. tariffs on Canada, as mentioned by Trump, reintroduces trade friction and political uncertainty. This specific geopolitical risk often fuels investor flight to safety, creating a counterbalancing force that could provide underlying support for Gold prices despite broader USD movements.
Price Action:
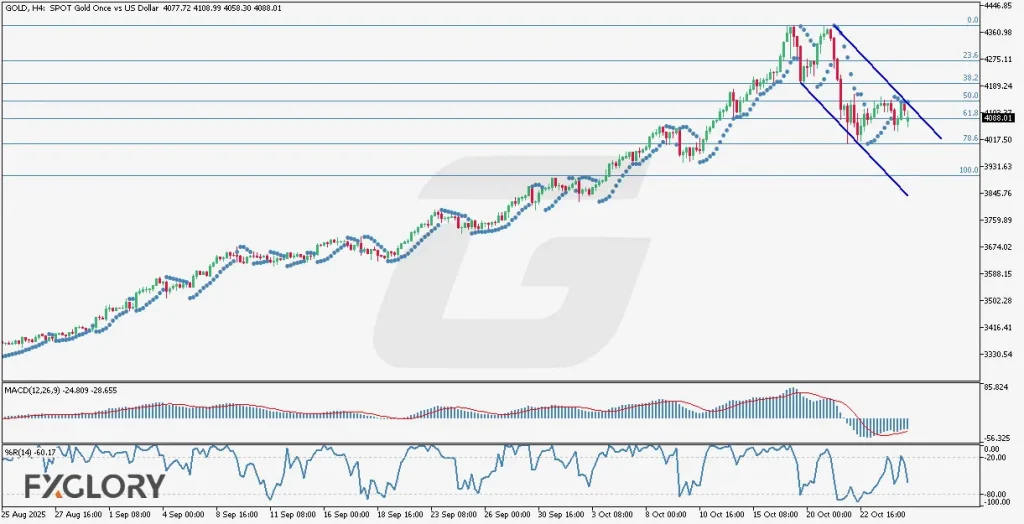
The XAUUSD price action on the H4 timeframe clearly shows a pronounced shift in momentum, reversing from its high around the 4381 mark. The subsequent bearish trend has established a persistent descending channel as seen in the chart, confirming that bears currently control the market direction. This descending movement has driven the Gold price to test crucial psychological levels, touching lows near 4100 and even deeper at 4004 before finding interim footing. The current price is firmly confined within this channel, signifying continued downside pressure, with every rally being used by sellers to re-establish short positions, making the Gold market forecast decidedly negative in the short-term.
Key Technical Indicators:
Parabolic SAR: The Parabolic SAR dots have been placed consistently above the candles, which is a definitive signal in technical analysis confirming the established bearish trend on the H4 timeframe. This alignment strongly supports the current downside momentum and suggests traders should maintain a short bias until a clear flip of the dots occurs below the price.
MACD (Moving Average Convergence Divergence): The MACD lines, currently sitting at -24.809 and -28.655, are deeply entrenched in negative territory. The wide divergence and position below the zero line indicate robust negative momentum, suggesting that the recent selling pressure for XAUUSD is strong and sustained.
Williams %R (R%14): The R%14 indicator reading of -60.17 is positioned in the middle range, well above the oversold area. This reading suggests that while the price is bearish, the market is not yet oversold on the H4 chart, implying that there is still technical room for the Gold price to fall lower toward the extreme bottom of the descending channel.
Support and Resistance:
Support: Immediate technical support level is found near 4004, aligning with a recent swing low and the lower boundary of the descending channel.
Resistance: Strong structural resistance level is located at 4140.000, coinciding with the 50.0% Fibonacci retracement level and the upper boundary of the descending channel.
Conclusion and Consideration:
The XAUUSD daily analysis on the H4 chart presents a strong bearish bias, driven by persistent price action within a descending channel and reinforced by key technical indicators like the Parabolic SAR and MACD. The short-term Gold market forecast suggests potential re-tests of the 4004 support unless the 4140 resistance is convincingly broken. Traders must, however, consider the volatility risk introduced by the conflicting USD fundamental analysis drivers: trade deal optimism potentially weighing on Gold, counterbalanced by tariff threats that could spark safe-haven buying.
Disclaimer: The analysis provided for XAU/USD is for informational purposes only and does not constitute investment advice. Traders are encouraged to perform their own analysis and research before making any trading decisions on XAUUSD. Market conditions can change quickly, so staying informed with the latest data is essential.