Time Zone: GMT +3
Time Frame: 4 Hours (H4)
Fundamental Analysis:
ETH/USD’s market movements today are likely to be significantly impacted by USD fundamentals. Key events include the release of US Existing Home Sales data, reflecting residential buildings sold, excluding new construction. A higher-than-forecasted figure would positively affect the USD, potentially placing downward pressure on ETH/USD. Additionally, speeches from Federal Reserve Governors Michelle Bowman and Michael Barr are expected, with hawkish remarks likely supporting the USD further. Traders should closely monitor these events, as they could trigger considerable volatility in the ETH/USD pair.
Price Action:
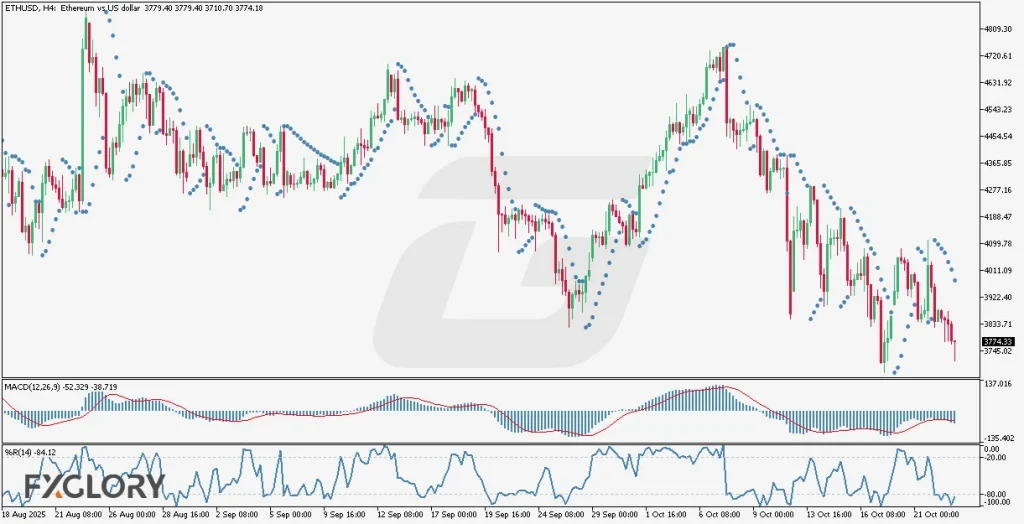
Analyzing ETH/USD in the H4 timeframe, candles indicate a prolonged bullish trend followed by a sideways consolidation. Recently, candles initiated a bearish correction, supported by the emergence of a regular positive divergence, hinting at a potential end to the bearish phase. If bullish momentum resumes, price action could test resistance near 4767.51. Alternatively, continuation of bearish correction might see prices revisit historical support around 3545.10.
Key Technical Indicators:
MACD: The histogram displays levels around -52.329, indicating strong bearish momentum. The MACD signal line remains above the MACD line, affirming the ongoing bearish correction, but traders should watch for a crossover signaling potential bullish momentum recovery.
William’s R%: The line is currently hovering at level -84.12, showing an oversold condition. This level typically precedes a bullish reversal, highlighting potential recovery scenarios for ETH/USD.
Parabolic SAR: Parabolic SAR dots are positioned above the candles, reinforcing the current bearish trend. However, if dots switch below the candles, it would signal a bullish reversal, confirming the positive divergence seen in other indicators.
Support and Resistance:
Support: Immediate support lies at the significant historical level of 3545.10, which has previously provided solid price stabilization.
Resistance: Strong resistance is observed at the recent high of 4767.51, a price level where ETH/USD struggled previously.
Conclusion and Consideration:
ETH/USD on the H4 chart currently depicts a bearish correction phase within an overarching bullish market context. Technical indicators, including the MACD, William’s R%, and Parabolic SAR, collectively suggest a possible bullish reversal in the near term. Traders should remain cautious and closely follow the fundamental USD news releases today, which could substantially influence market volatility and price direction.
Disclaimer: The analysis provided for ETH/USD is for informational purposes only and does not constitute investment advice. Traders are encouraged to perform their own analysis and research before making any trading decisions on ETHUSD. Market conditions can change quickly, so staying informed with the latest data is essential.