Time Zone: GMT +3
Time Frame: 4 Hours (H4)
Fundamental Analysis:
Today, the USD/CAD pair may experience increased volatility due to key economic events from Canada and the US. Canada is releasing crucial CPI (Consumer Price Index) data, an essential indicator of inflation influencing monetary policy and interest rates. Higher-than-expected CPI readings typically strengthen the Canadian dollar (CAD). Additionally, USD traders will closely monitor remarks from Federal Reserve Governor Christopher Waller during the Federal Reserve Board Payments Innovation Conference, as hawkish sentiments can provide bullish support for the USD.
Price Action:
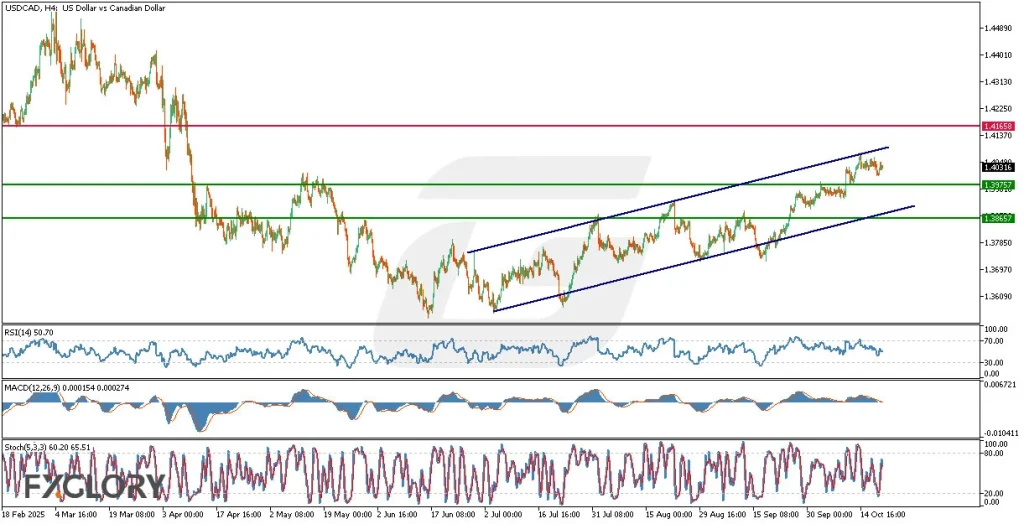
The USD-CAD pair analysis on the H4 timeframe illustrates a clear bullish trend moving within an ascending price channel. Currently, the price hovers around the upper band of this channel, suggesting potential retracement or consolidation. A pullback towards immediate support around 1.39757 is plausible; breaking this level may lead the price towards secondary support at 1.38657 or the channel’s lower boundary. Conversely, a breakout above the channel could target resistance at 1.41658.
Key Technical Indicators:
RSI (14): The Relative Strength Index (RSI) stands at 50.70, indicating neutral momentum. The current position suggests equilibrium between buyers and sellers, allowing for either continuation or a retracement within the ascending channel.
MACD (12,26,9): The Moving Average Convergence Divergence (MACD) displays minimal positive divergence, signaling weakening bullish momentum. Traders should remain cautious and monitor potential bearish crossovers, indicating a shift toward selling pressure.
Stochastic (5,3,3): The Stochastic indicator registers values of 60.20 and 65.51, indicating moderate bullish strength but suggesting the pair is not yet in overbought conditions. A further rise or mild consolidation is likely before significant reversals occur.
Support and Resistance:
Support: Immediate support is located at 1.39757, aligning with recent price consolidation. Secondary support is positioned at 1.38657, coinciding with the ascending channel’s lower boundary.
Resistance: The nearest resistance level is at 1.41658, aligning with the upper horizontal resistance and recent highs.
Conclusion and Consideration:
The technical analysis of the USD CAD H4 chart reveals sustained bullish momentum within an ascending channel, supported by RSI, MACD, and Stochastic indicators. Given today’s economic news releases, traders must be cautious, as volatility could increase dramatically, influenced by Canadian CPI figures and speeches from the Federal Reserve. Monitoring the critical support and resistance levels mentioned is essential for identifying breakout or reversal points.
Disclaimer: The analysis provided for USD/CAD is for informational purposes only and does not constitute investment advice. Traders are encouraged to perform their own analysis and research before making any trading decisions on USDCAD. Market conditions can change quickly, so staying informed with the latest data is essential.