Time Zone: GMT +3
Time Frame: 4 Hours (H4)
Fundamental Analysis:
The NZD/USD currency pair will experience significant volatility today due to critical economic releases from both countries. New Zealand will release its Consumer Price Index (CPI), a primary gauge of consumer inflation. Higher-than-expected CPI figures usually strengthen the New Zealand Dollar as they increase expectations for potential interest rate hikes by the Reserve Bank of New Zealand. Conversely, the US will publish the Conference Board’s Leading Indicators, which forecast economic trends. Higher figures typically support USD strength, potentially affecting the NZD USD pair dynamics.
Price Action:
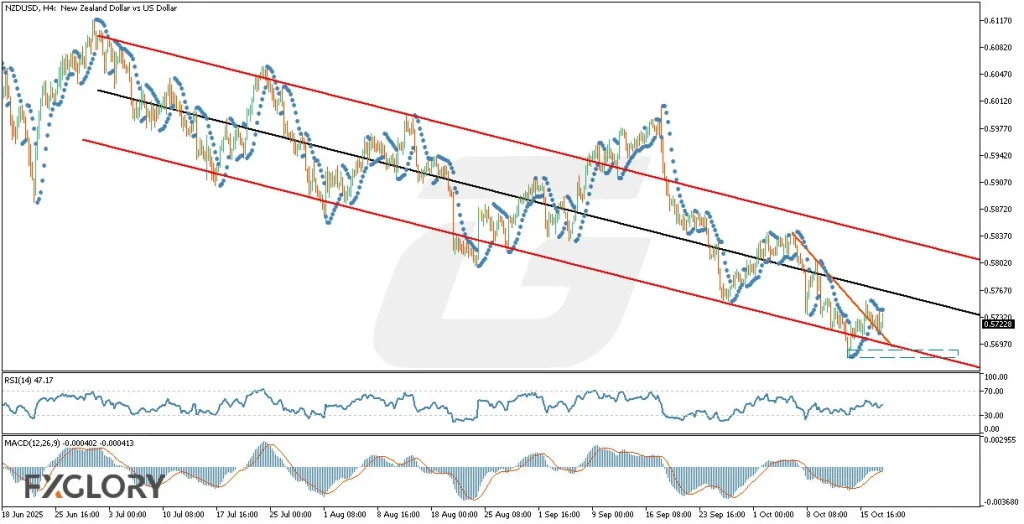
The NZD-USD analysis on the H4 timeframe clearly indicates a bearish market sentiment. After reacting to the lower line of the descending channel, the NZDUSD pair is currently shaping a correctional movement towards the mid-line. Price action traders should closely monitor this area, as a break below the recent low could establish a new lower low, reinforcing the ongoing bearish trend.
Key Technical Indicators:
Parabolic SAR: The Parabolic SAR dots have shifted below the price, indicating a short-term bullish correction. However, caution is advised, as the general trend remains downward.
RSI (14): The RSI reading stands at 47.17, signaling neutral momentum. This level indicates potential room for the price to fluctuate in either direction, providing no immediate signs of overbought or oversold conditions.
MACD (12,26,9): MACD histogram values are negative (-0.0042, -0.000413), though diminishing, suggesting a slowdown in bearish momentum. Traders should remain vigilant for a potential bullish crossover that could indicate an extended upward correction.
Support and Resistance:
Support: The immediate support zone is identified near the recent low at 0.5690, closely aligning with the descending channel’s lower boundary.
Resistance: Immediate resistance is near 0.5760, corresponding to the mid-line of the descending channel and previous short-term peaks.
Conclusion and Consideration:
The NZD-USD H4 chart technical analysis indicates a predominant bearish trend with short-term corrective moves upwards. Technical indicators, including Parabolic SAR, RSI, and MACD, suggest cautious optimism for brief bullish corrections but highlight that the overall bearish market structure remains intact. Given today’s critical economic announcements, particularly New Zealand’s CPI and US leading economic indicators, traders must anticipate heightened volatility and exercise prudent risk management.
Disclaimer: The analysis provided for NZD/USD is for informational purposes only and does not constitute investment advice. Traders are encouraged to perform their own analysis and research before making any trading decisions on NZDUSD. Market conditions can change quickly, so staying informed with the latest data is essential.