Time Zone: GMT +3
Time Frame: 4 Hours (H4)
Fundamental Analysis:
The BTC/USD pair continues to face notable volatility amid tightening global monetary sentiment and uncertainty surrounding U.S. regulatory frameworks for cryptocurrencies. Today’s USD-related news events, featuring Federal Reserve officials Stephen Miran, Neel Kashkari, and Alberto Musalem, are expected to bring potential volatility to the dollar market. As these FOMC voting members participate in high-profile economic discussions, any hawkish comments hinting at tighter monetary policy could strengthen the USD and place short-term bearish pressure on Bitcoin. On the other hand, if their tone leans dovish, BTC USD might find some relief, especially as investors seek alternative assets amid inflationary concerns.
Price Action:
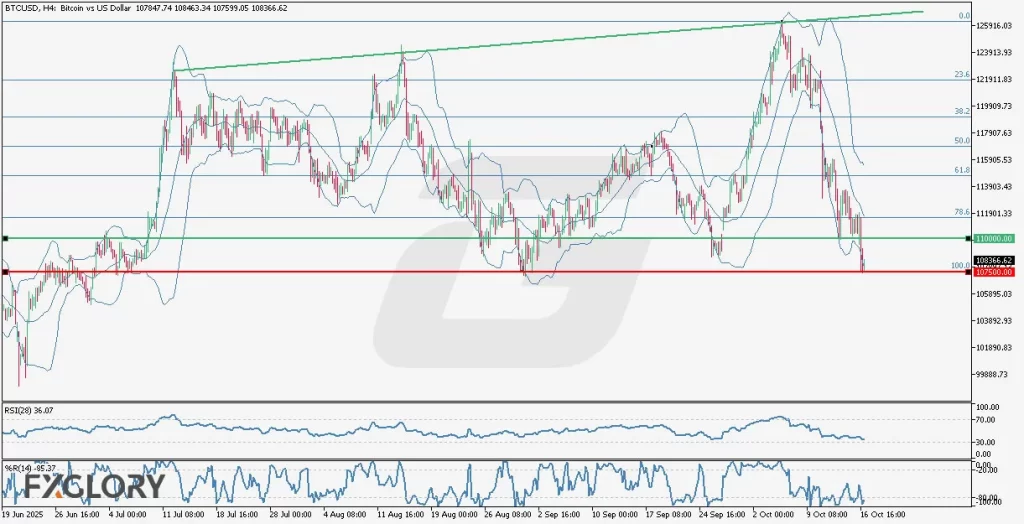
The BTC/USD H4 chart shows that Bitcoin has been in a descending trend, with an approximate -14.5% drop from the previous high. After touching the $107,500 support zone, the price formed a new green bullish candle, signaling potential short-term buying pressure. This support level has been tested multiple times, highlighting its strength as a key demand area. However, a single bullish candle is insufficient to confirm a long-term reversal. The next resistance lies near $110,000, aligning with the 78.6% Fibonacci retracement zone. Traders should watch closely to see if Bitcoin can sustain above $107,500 or if the bears will regain control and drive the price lower.
Key Technical Indicators:
Bollinger Bands: BTC-USD trades in the lower half of the Bands, touching the lower boundary, signaling sustained bearish pressure with a possible short-term rebound.
RSI (28): The RSI at 36.07 hovers near oversold territory, suggesting selling momentum is weakening and a short-term bounce could occur.
%R (14): The %R at -85.37 confirms an oversold condition, indicating potential for a limited recovery if buying pressure emerges.erm, increasing the likelihood of a technical bounce if buying volume picks up near the $107,500 zone.
Support and Resistance:
Support: Immediate and strong support is established around $107,500, a key psychological and Fibonacci-based level that has been tested multiple times and previously triggered bullish reactions.
Resistance: The nearest resistance stands at $110,000, aligning with the 78.6% Fibonacci retracement level and marking the next barrier for any bullish continuation attempt.
Conclusion and Consideration:
The BTC/USD H4 technical outlook indicates a market at a crucial inflection point. While the price action suggests potential for a short-term rebound from the $107,500 area, confirmation from additional bullish candles and improving RSI is essential before assuming a trend reversal. The broader structure remains bearish unless Bitcoin breaks above $110,000 with volume support. Fundamentally, traders should stay alert to Federal Reserve speakers’ remarks today, as any hawkish tone could strengthen the dollar and pressure BTCUSD further. Short-term traders may look for intraday buying opportunities near support, while medium-term investors should wait for clearer confirmation of trend reversal signals.
Disclaimer: The analysis provided for BTC/USD is for informational purposes only and does not constitute investment advice. Traders are encouraged to perform their own analysis and research before making any trading decisions on BTCUSD. Market conditions can change quickly, so staying informed with the latest data is essential.