Time Zone: GMT +3
Time Frame: 4 Hours (H4)
Fundamental Analysis:
The LTC/USD cryptocurrency pair has been positively influenced by Bitcoin’s recent surge above $125,000, driving optimistic sentiment across the crypto market. Additionally, ongoing speculations around ETF approvals and increased institutional interest provide bullish momentum for Litecoin. However, the crypto sector continues to face regulatory headwinds, particularly with EU watchdogs urging stricter oversight on stablecoins, which could introduce short-term volatility and cautious sentiment among investors.
Price Action:
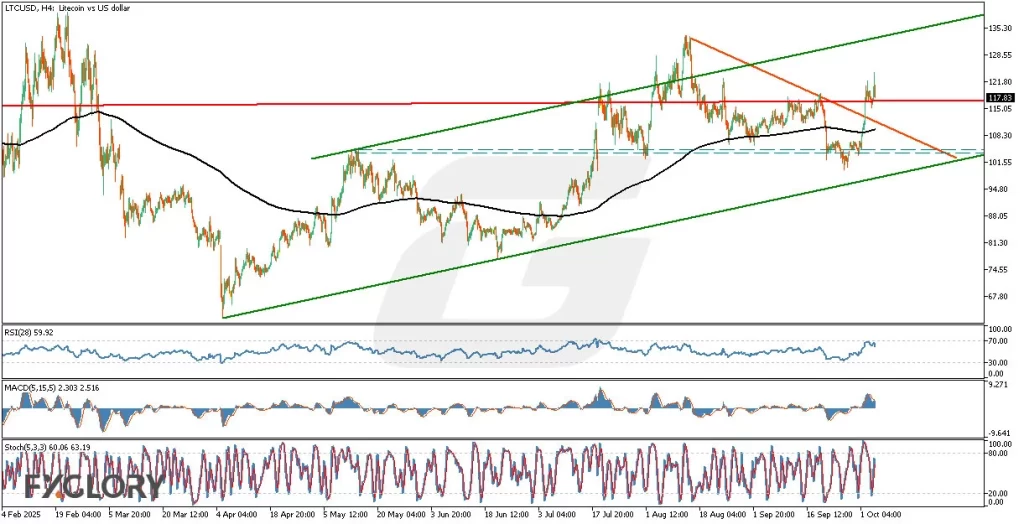
The LTCUSD pair on the H4 chart recently exhibited a sharp upward movement and is now facing strong resistance at the upper band of a sideways channel. The pair has successfully broken through the correction resistance line, indicating bullish intent. A retracement towards the 105.00 level would present an ideal buying opportunity, provided support holds. If bullish momentum persists, the upper boundary of the ascending channel serves as the next potential target.
Key Technical Indicators:
EMA (300): The EMA (300) is significantly below the current price, indicating a potential overextension and signaling a likely near-term correction.
RSI (28): The RSI is approaching overbought territory, suggesting limited upward potential in the immediate term and hinting at an impending price retracement.
MACD (5,15,5): The MACD is currently bullish, with the MACD line above the signal line, but the histogram’s diminishing bars indicate decreasing bullish momentum.
Stochastic (5,3,3): The Stochastic indicator is currently within overbought levels, increasing the probability of short-term corrective movements or sideways consolidation.
Support and Resistance:
Support: Immediate support is observed at approximately 105.00, coinciding with the recently broken resistance line. Secondary support lies at the lower boundary of the sideways channel.
Resistance: Immediate resistance is located at the upper boundary of the current sideways channel, followed by the upper boundary of the ascending channel.
Conclusion and Consideration:
The LTC-USD H4 chart analysis currently reflects bullish tendencies, underpinned by recent price action and key technical indicators. However, caution is warranted due to signs of weakening bullish momentum indicated by RSI, MACD, and Stochastic indicators. Traders should closely monitor potential retracement levels around 105.00 for buying opportunities and remain vigilant about regulatory developments that could introduce volatility.
Disclaimer: The analysis provided for LTC/USD is for informational purposes only and does not constitute investment advice. Traders are encouraged to perform their own analysis and research before making any trading decisions on LTCUSD. Market conditions can change quickly, so staying informed with the latest data is essential.