Time Zone: GMT +3
Time Frame: 4 Hours (H4)
Fundamental Analysis:
The Australian Dollar (AUD) today is driven by the Consumer Price Index (CPI y/y) release, which came in at 2.9% versus the 2.8% forecast. This slightly stronger-than-expected inflation print supports the AUD, as it raises expectations that the Reserve Bank of Australia (RBA) may adopt a more hawkish stance in the near term. On the US Dollar (USD) side, traders are watching a busy news flow, including President Trump’s speech at the United Nations and US New Home Sales data (652K vs 650K expected), alongside Crude Oil Inventories (+0.8M vs -9.3M previous). While the CPI data favors AUD strength, the USD may see volatility depending on geopolitical remarks and housing market resilience.
Price Action:
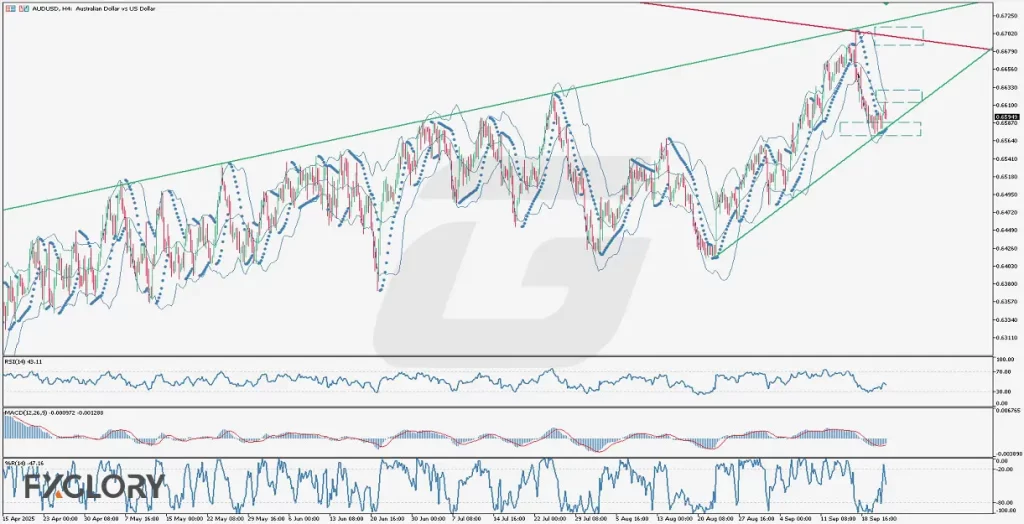
The AUDUSD H4 chart reveals the pair trading within a long-term ascending channel. After reaching a resistance zone near the upper Bollinger Band, the pair retraced lower, printing consecutive bearish candles. Currently, the price is moving around the middle Bollinger Band, which acts as a pivot support level. If the middle band holds, the pair could resume its bullish momentum; however, a decisive break below may push the price toward the lower support area highlighted on the chart near 0.6570–0.6585.
Key Technical Indicators:
Bollinger Bands: The price has been oscillating between the upper and middle bands. After rejection from the upper band near 0.6613, the candles retraced lower. The price is now testing the middle Bollinger Band, which is crucial—holding this level may invite fresh buying, but breaking below it exposes the lower band around 0.6570.
Parabolic SAR: Dots are currently positioned below the candles, indicating that the short-term trend remains bullish despite the recent correction. If the price breaks lower and dots shift above the candles, it would confirm a bearish continuation.
RSI (Relative Strength Index): The RSI stands at 43.11, slightly below the neutral 50 level, suggesting weakened bullish momentum. The indicator shows that sellers have gained short-term control, but no oversold conditions are present yet, leaving room for both recovery and continuation of the down move.
MACD (Moving Average Convergence Divergence): The MACD histogram remains negative, with the MACD line below the signal line. This reflects a bearish short-term momentum and suggests that downside risks remain unless momentum turns back above the zero line.
Williams %R: At -47.15, the Williams %R is in the neutral zone, showing neither overbought nor oversold conditions. Momentum is slightly bearish, and a drop toward -80 would hint at oversold territory and possible rebound signals.
Support and Resistance:
Support: The nearest support is located at 0.6570–0.6585, which coincides with the lower Bollinger Band and a previous demand zone.
Resistance: The resistance lies at 0.6680–0.6720, where the pair recently reversed after testing the upper Bollinger Band and long-term trendlines.
Conclusion and Consideration:
The AUDUSD pair on the H4 timeframe is at a decisive juncture. While the broader ascending channel supports bullish continuation, current technical signals show mixed momentum. The RSI and MACD are pointing to bearish pressure, yet the Parabolic SAR remains bullish, and the Stochastic RSI hints at possible rebound from oversold conditions. Fundamentally, AUD strength is supported by higher-than-expected inflation, but the USD side may see volatility from speeches and data releases today. Traders should watch the 0.6570 support and 0.6720 resistance as critical levels for the next directional move.
Disclaimer: The analysis provided for AUD/USD is for informational purposes only and does not constitute investment advice. Traders are encouraged to perform their own analysis and research before making any trading decisions on AUDUSD. Market conditions can change quickly, so staying informed with the latest data is essential.