Time Zone: GMT +3
Time Frame: 4 Hours (H4)
Fundamental Analysis:
The GBP USD currency pair reflects the relative strength between the British Pound (GBP) and the US Dollar (USD). Traders should anticipate increased volatility today due to several key economic releases. For the USD, significant events include speeches by Federal Reserve officials, including Chair Jerome Powell, Governor Michelle Bowman, and Atlanta Fed President Raphael Bostic. Furthermore, US current account balance figures and PMI releases for manufacturing and services sectors are due, potentially influencing USD demand. Meanwhile, the GBP faces volatility from PMI data in the manufacturing and services sectors, BOE Chief Economist Huw Pill’s speech, and the CBI Industrial Order Expectations. Traders must closely watch these events, as positive economic indicators or hawkish rhetoric could strengthen either currency.
Price Action:
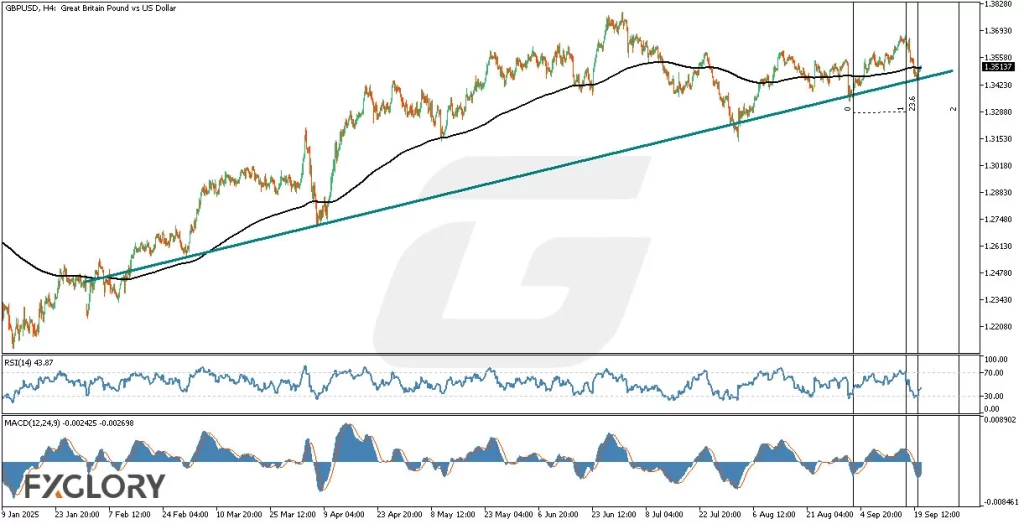
On the GBP-USD H4 chart, price action indicates a significant bullish reaction after hitting a critical support line. Despite this bullish response, the recent strong bearish correction retraced approximately 68% of the prior bullish impulse in just 23% of the time it took for that impulse to form. This rapid and deep retracement signifies strong bearish momentum and potential instability in the bullish structure. Traders should remain cautious of a possible renewed bearish correction and closely observe price reactions at critical resistance zones.
Key Technical Indicators:
EMA (220): The EMA (220) is currently positioned near the price level at approximately 1.3531, acting as dynamic resistance. Should the price fail to decisively break and hold above this EMA, traders should be prepared for a potential resumption of bearish pressure.
RSI (14): The RSI is currently at 43 and heading toward the neutral 50 level. This indicates weak bullish momentum and suggests that the market remains cautious. A clear break above the 50 level could confirm stronger bullish sentiment, while a reversal from here could signal bearish pressure.
MACD (12,24,9): The MACD histogram is currently below zero but starting to flatten, suggesting weakening bearish momentum. A bullish crossover of the MACD line above the signal line could indicate a potential bullish shift in sentiment.
Support and Resistance:
Support: Immediate support is at the trendline around 1.3480, reinforced by recent bullish reaction points. Further down, psychological and historical support lies at approximately 1.3400.
Resistance: Immediate resistance stands at the EMA (220) near 1.3531, followed by stronger resistance at recent swing highs around the 1.3600 psychological level.
Conclusion and Consideration:
The GBPUSD H4 analysis suggests cautious optimism for bulls, tempered by significant bearish pressures evident in recent price action. Key technical indicators like the EMA (220), RSI, and MACD indicate potential bullish scenarios but require confirmation through additional bullish momentum. Fundamental events scheduled today could dramatically influence price direction, making careful monitoring essential. Traders are advised to employ robust risk management strategies and remain attentive to evolving market conditions.
Disclaimer: The analysis provided for GBP/USD is for informational purposes only and does not constitute investment advice. Traders are encouraged to perform their own analysis and research before making any trading decisions on GBPUSD. Market conditions can change quickly, so staying informed with the latest data is essential.