Time Zone: GMT +3
Time Frame: 4 Hours (H4)
Fundamental Analysis:
Today, USD-JPY traders should closely monitor key events from both currencies involved. The Japanese Yen (JPY) is influenced by upcoming economic data, particularly the release of Japan’s Core Consumer Price Index (CPI) and announcements from the Bank of Japan (BOJ). A higher-than-forecast Core CPI could bolster JPY’s value, reflecting economic strength and possible monetary tightening. Conversely, the BOJ’s interest rate decision and policy statements scheduled for October 30, 2025, hold significant implications, with traders assessing potential shifts toward hawkishness. For USD, attention shifts to the Federal Reserve Bank of San Francisco President Mary Daly’s remarks regarding AI and labor market implications. Hawkish commentary from the FOMC member could positively influence USD strength.
Price Action:
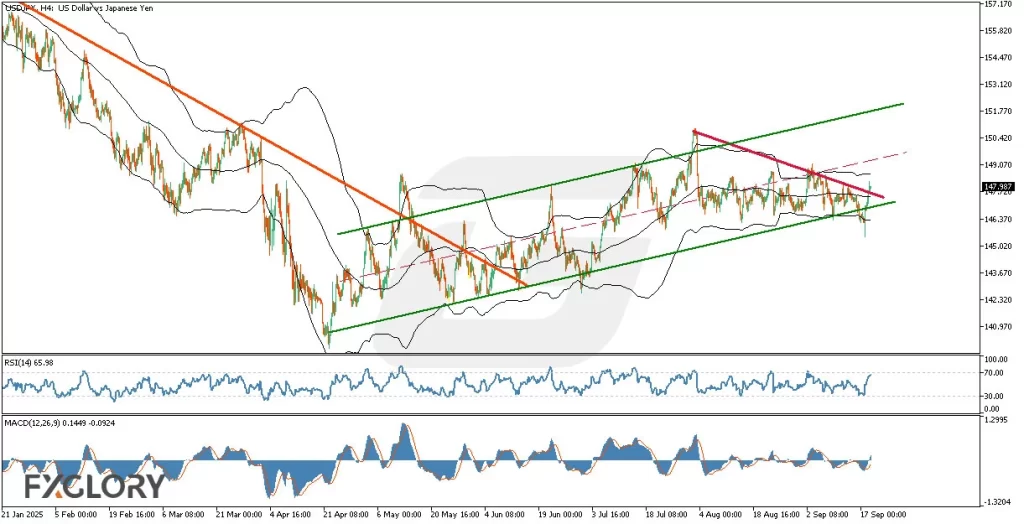
Analyzing USD/JPY price action in the H4 timeframe reveals an ascending channel formation. Recently, after hitting the lower Bollinger Band near the channel’s bottom, USDJPY bounced upwards, indicating renewed bullish momentum. The current price action above the Bollinger Bands’ middle line suggests continued bullish sentiment, targeting potentially the channel’s median line, and further supporting the positive bias.
Key Technical Indicators:
Bollinger Bands: USDJPY’s price is above the middle Bollinger Band, reinforcing bullish momentum. Currently approaching the upper band, traders should anticipate possible minor retracements, yet the bullish trend remains intact, targeting mid-channel levels.
RSI (14): The RSI indicator currently sits at 65.98 and continues moving toward the overbought threshold of 70. While this confirms bullish momentum, traders should prepare for potential corrections once overbought conditions are reached, signaling short-term selling opportunities.
MACD (12,26,9): MACD is positive at 0.1449 but slightly decreasing with a histogram reading of -0.0924, indicating bullish sentiment remains, albeit with declining momentum. Traders should observe closely for bearish crossovers that might suggest potential trend reversals.
Support and Resistance:
Support: Immediate support for USDJPY is identified around 146.300, near the bottom of the ascending channel and lower Bollinger Band.
Resistance: Immediate resistance stands at 149.070, aligning with recent highs and the ascending channel’s upper boundary.
Conclusion and Consideration:
The USD-JPY pair maintains bullish momentum on the H4 chart, confirmed by the ascending channel, Bollinger Bands positioning, and supportive RSI and MACD indicators. However, traders should be cautious as RSI approaches overbought territory, and the MACD indicates slightly waning bullish strength. Economic events impacting USD and JPY, particularly CPI data and BOJ statements, could significantly influence volatility and direction. Appropriate risk management and vigilance toward upcoming economic releases are advised.
Disclaimer: The analysis provided for USD/JPY is for informational purposes only and does not constitute investment advice. Traders are encouraged to perform their own analysis and research before making any trading decisions on USDJPY. Market conditions can change quickly, so staying informed with the latest data is essential.