Time Zone: GMT +3
Time Frame: 4 Hours (H4)
Fundamental Analysis:
The AUD/USD currency pair today is anticipated to exhibit significant volatility due to crucial economic data releases from both Australia and the US. The Australian Bureau of Statistics is set to release employment data, which significantly impacts the Australian Dollar (AUD). Positive employment figures exceeding forecasts would strengthen AUD as employment growth directly correlates with higher consumer spending and economic confidence. Concurrently, the USD may experience volatility due to the release of initial jobless claims and Philadelphia Fed Manufacturing Index. Lower-than-expected jobless claims and higher manufacturing index figures would enhance USD strength.
Price Action:
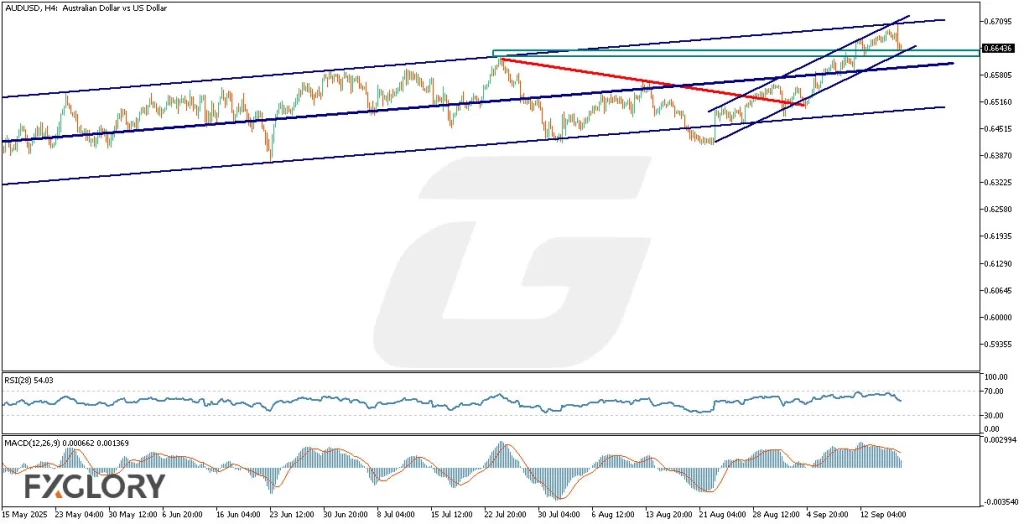
Technical analysis of AUDUSD on the H4 timeframe indicates a bullish sentiment within an ascending channel, with price currently testing the upper boundary. Additionally, price action reveals a smaller ascending channel formation indicating short-term bullish strength. Currently, AUD-USD has encountered resistance at the previous high area, which may now act as a crucial support zone. The recent formation of three consecutive bearish candles, resembling a “Three Black Crows” pattern, signals potential short-term bearish correction toward the midpoint of the larger ascending channel, before a possible bullish resumption.
Key Technical Indicators:
RSI (28): The RSI indicator at 54 suggests neutral momentum. The current RSI level implies that AUDUSD has ample room for price movements in either direction without immediate overbought or oversold conditions. This aligns with the possibility of corrective moves towards channel midpoint support before resuming an upward trajectory.
MACD (12,26,9): MACD readings currently stand at 0.000662 (MACD line) and 0.001369 (signal line), indicating slight bearish momentum due to the MACD line being below the signal line. This condition points towards potential short-term bearishness or a corrective pullback within the ongoing bullish channel.
Support and Resistance:
Support: Immediate key support is found at the recent high zone, approximately at 0.7420, which coincides with the midpoint of the larger ascending channel. Additional support is visible near 0.7380, the lower boundary of the smaller channel.
Resistance: Current resistance lies around the top boundary of the ascending channel at approximately 0.7485, with further resistance anticipated near psychological level 0.7500.
Conclusion and Consideration:
Technical indicators and price action analysis for AUD-USD on the H4 chart suggest a potential short-term corrective move downwards, aligning with RSI neutrality and MACD bearish signals. However, the broader bullish channel remains intact, suggesting eventual bullish continuation towards the channel’s upper boundaries. Traders must closely monitor today’s economic news releases from Australia and the US, as these fundamental factors may significantly impact market volatility and direction.
Disclaimer: The analysis provided for AUD/USD is for informational purposes only and does not constitute investment advice. Traders are encouraged to perform their own analysis and research before making any trading decisions on AUDUSD. Market conditions can change quickly, so staying informed with the latest data is essential.