Time Zone: GMT +3
Time Frame: 4 Hours (H4)
Fundamental Analysis:
The USD/CAD currency pair’s volatility today will significantly depend on the scheduled economic releases. Key USD data such as Retail Sales Ex Autos, Import Price Index, Industrial Production, Capacity Utilization Rate, and NAHB Housing Market Index could considerably influence the pair. A stronger-than-expected result in these indicators could propel the US dollar higher against its Canadian counterpart. Conversely, Canada’s economic data remains relatively quiet today, placing the focus squarely on USD-driven market dynamics.
Price Action:
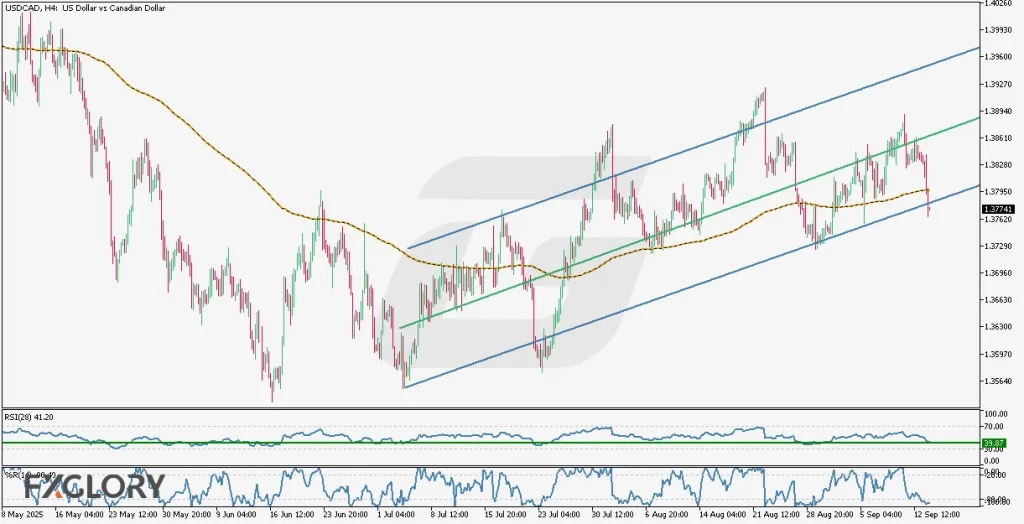
Analyzing USD/CAD on the H4 timeframe, after a period of bearish movement, price action transitioned into a bullish trend, forming a clear ascending channel. Price movements have predominantly reacted to the channel’s midline, illustrating it as a significant level of dynamic support and resistance. Recently, price candles breached the channel’s lower trend line; however, current momentum suggests this break might be short-lived. A bullish re-entry back into the channel is highly probable, targeting the midline resistance around the 1.3885 level.
Key Technical Indicators:
RSI (28): The Relative Strength Index indicator stands at 41.20, indicating proximity to the crucial 39.87 level. Historically, reaching this RSI level has consistently triggered bullish reversals, reinforcing the probability of an upward price correction shortly.
Williams %R: The Williams %R indicator currently sits around -90.69, indicating severely oversold conditions. Such levels generally precede bullish recoveries, aligning with the potential price reversal back within the bullish channel.
Moving Average (200): Price candles are trading slightly below the 200-period moving average, signifying short-term bearishness. However, as candles frequently oscillate around this line, the current positioning might indicate an overshoot rather than a genuine bearish breakout.
Support and Resistance:
Support: Immediate and strong support is visible at the recent breakout level near 1.3725, followed by further support at the lower boundary of the ascending channel.
Resistance: The most immediate resistance is positioned at the channel’s midline around 1.3885, with further resistance at the channel’s upper boundary.
Conclusion and Consideration:
The technical analysis of the USD/CAD pair indicates a likely bullish reversal from the current oversold conditions, as supported by RSI, Williams %R, and historical price action patterns. Traders should pay close attention to today’s USD economic data releases, which may significantly influence price volatility. Given the currency pair’s current dynamics, traders should be cautious and look for confirmations before taking bullish positions targeting the midline resistance at 1.3885.
Disclaimer: The analysis provided for USD/CAD is for informational purposes only and does not constitute investment advice. Traders are encouraged to perform their own analysis and research before making any trading decisions on USDCAD. Market conditions can change quickly, so staying informed with the latest data is essential.