Time Zone: GMT +3
Time Frame: 4 Hours (H4)
Fundamental Analysis:
The XAGUSD (Silver/US Dollar) pair is influenced by today’s significant economic event, the New York Manufacturing Index release from the Federal Reserve Bank of New York. Traders closely monitor this index as an important indicator of economic health in the U.S., where a higher-than-expected figure generally strengthens the USD, potentially adding pressure to commodities priced in USD, such as silver. Consequently, market volatility may increase around the time of this news release.
Price Action:
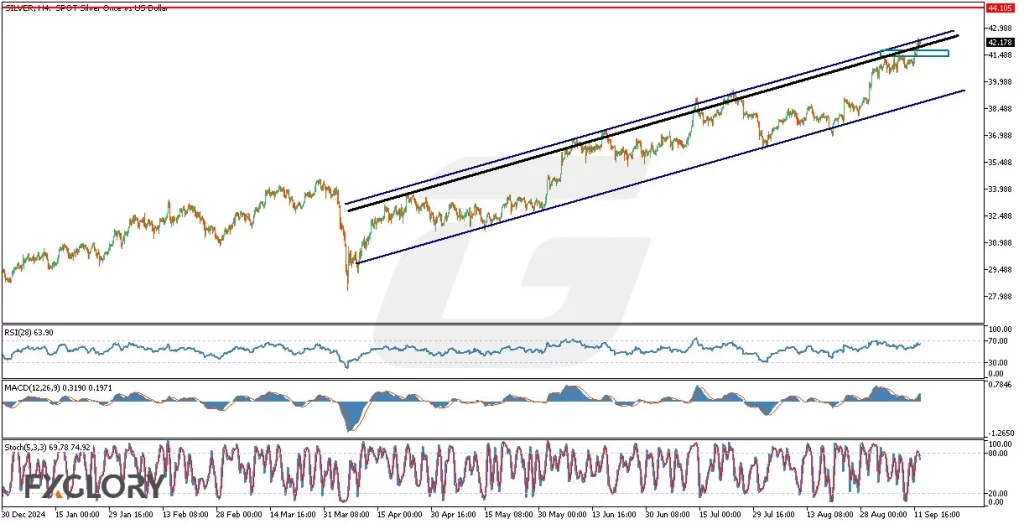
Analyzing the price action on the H4 timeframe, XAG/USD has been consistently trading within an ascending channel. Currently, the price is testing the upper boundary of the channel, displaying difficulty in breaking above this resistance. If the bulls fail to maintain momentum, a corrective move toward the lower support zone is likely. However, a decisive breakout above the upper channel boundary could extend the bullish move, potentially targeting around 44.200, a level unseen since 2011.
Key Technical Indicators:
RSI (28): The RSI is currently at 64, suggesting moderate bullish momentum. However, it remains below the overbought threshold (70), indicating potential room for further upward movement before encountering significant resistance.
MACD (12,26,9): The MACD histogram is positive (0.32), positioned above the signal line (0.2), indicating prevailing bullish momentum. Traders should remain vigilant for signs of declining momentum, which could precede a correction.
Stochastic Oscillator (5,3,3): Stochastic values are presently at 70 and 75, indicating the asset is nearing overbought territory. Traders should monitor this closely, as a stochastic cross below the 80 level could suggest an impending bearish reversal or correction.
Support and Resistance:
Support: Immediate support is located near the 41.200-41.500 area, which aligns with the lower boundary of the ascending channel and previous consolidation zones.
Resistance: The critical resistance lies at the channel’s upper band around 42.200, followed by the key psychological target of 44.200 if bullish momentum persists.
Conclusion and Consideration:
XAG-USD’s price action on the H4 chart indicates continued bullish sentiment within the ascending channel. However, key indicators such as RSI, MACD, and Stochastic hint at potential short-term exhaustion or correction. Traders should carefully watch for price reactions at current resistance levels and the forthcoming U.S. economic release. Due to potential volatility around the New York Manufacturing Index, prudent risk management and vigilance are advised.
Disclaimer: The analysis provided for XAG/USD is for informational purposes only and does not constitute investment advice. Traders are encouraged to perform their own analysis and research before making any trading decisions on XAGUSD. Market conditions can change quickly, so staying informed with the latest data is essential.